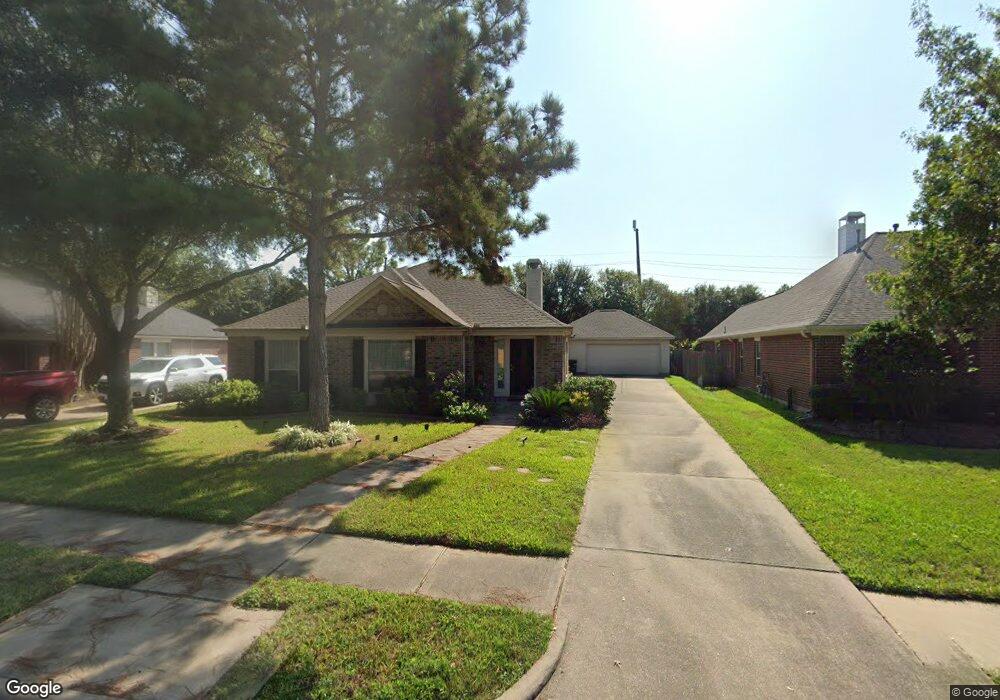
16631 Gentle Stone Dr Houston, TX 77095
Copperfield NeighborhoodEstimated Value: $336,031 - $356,000
3
Beds
2
Baths
2,190
Sq Ft
$158/Sq Ft
Est. Value
About This Home
This home is located at 16631 Gentle Stone Dr, Houston, TX 77095 and is currently estimated at $346,758, approximately $158 per square foot. 16631 Gentle Stone Dr is a home located in Harris County with nearby schools including Birkes Elementary School, Aragon Middle School, and Langham Creek High School.
Ownership History
Date
Name
Owned For
Owner Type
Purchase Details
Closed on
Nov 25, 2024
Sold by
Singh Seema and Singh Gurdeep
Bought by
Dua Sangeeta and Dua Vinod Kumar
Current Estimated Value
Purchase Details
Closed on
Jul 27, 2012
Sold by
Fuentes Cassandra N
Bought by
Dua Sangeeta and Singh Seema
Home Financials for this Owner
Home Financials are based on the most recent Mortgage that was taken out on this home.
Original Mortgage
$131,840
Interest Rate
3.72%
Mortgage Type
New Conventional
Purchase Details
Closed on
Feb 26, 2004
Sold by
Perry Homes
Bought by
Fuentes Cassandra N
Home Financials for this Owner
Home Financials are based on the most recent Mortgage that was taken out on this home.
Original Mortgage
$153,717
Interest Rate
5.65%
Mortgage Type
FHA
Create a Home Valuation Report for This Property
The Home Valuation Report is an in-depth analysis detailing your home's value as well as a comparison with similar homes in the area
Home Values in the Area
Average Home Value in this Area
Purchase History
| Date | Buyer | Sale Price | Title Company |
|---|---|---|---|
| Dua Sangeeta | -- | None Listed On Document | |
| Dua Sangeeta | -- | None Listed On Document | |
| Dua Sangeeta | -- | None Available | |
| Fuentes Cassandra N | -- | Chicago Title |
Source: Public Records
Mortgage History
| Date | Status | Borrower | Loan Amount |
|---|---|---|---|
| Previous Owner | Dua Sangeeta | $131,840 | |
| Previous Owner | Fuentes Cassandra N | $153,717 |
Source: Public Records
Tax History Compared to Growth
Tax History
| Year | Tax Paid | Tax Assessment Tax Assessment Total Assessment is a certain percentage of the fair market value that is determined by local assessors to be the total taxable value of land and additions on the property. | Land | Improvement |
|---|---|---|---|---|
| 2025 | $7,776 | $303,820 | $70,039 | $233,781 |
| 2024 | $7,776 | $319,599 | $70,039 | $249,560 |
| 2023 | $7,776 | $313,798 | $70,039 | $243,759 |
| 2022 | $7,813 | $295,482 | $51,952 | $243,530 |
| 2021 | $6,361 | $227,108 | $51,952 | $175,156 |
| 2020 | $5,803 | $201,207 | $43,101 | $158,106 |
| 2019 | $5,715 | $192,688 | $36,944 | $155,744 |
| 2018 | $2,923 | $203,000 | $36,944 | $166,056 |
| 2017 | $6,166 | $207,174 | $36,944 | $170,230 |
| 2016 | $5,400 | $181,442 | $36,944 | $144,498 |
| 2015 | $5,810 | $199,268 | $36,944 | $162,324 |
| 2014 | $5,810 | $186,577 | $36,944 | $149,633 |
Source: Public Records
Map
Nearby Homes
- 16611 Gentle Stone Dr
- 16511 Crystal View Ct
- 8714 Ridgebury Cir
- 8855 Distant Woods Dr
- 16426 Torry View Terrace
- 16606 Stoneside Dr
- 8619 Arranmore Ln
- 16514 Innisbrook Dr
- 16410 Dawnblush Ct
- 16403 Torry View Terrace
- 16602 Grenada Falls Dr
- 16335 Drystone Ln
- 16827 Newlight Bend Dr
- 16510 Wellers Way
- 9406 Morley Lake Dr
- 8806 Gas Light Village Dr
- 8411 Sandestine Ct
- 8550 Waiting Spring Ln
- 16535 Oat Mill Dr
- 17215 Shallow Lake Ln
- 16627 Gentle Stone Dr
- 16635 Gentle Stone Dr
- 16623 Gentle Stone Dr
- 8710 Gentle Stone Ct
- 8706 Gentle Stone Ct
- 16630 Gentle Stone Dr
- 16619 Gentle Stone Dr
- 16626 Gentle Stone Dr
- 16634 Gentle Stone Dr
- 16622 Gentle Stone Dr
- 16702 Gentle Stone Dr
- 16618 Gentle Stone Dr
- 16618 Crystal View Cir
- 16614 Crystal View Cir
- 16622 Crystal View Cir
- 16706 Gentle Stone Dr
- 16610 Crystal View Cir
- 8702 Gentle Stone Ct
- 16614 Gentle Stone Dr
- 16623 Lasting Shadow Cir