Estimated Value: $375,000 - $452,000
3
Beds
3
Baths
1,620
Sq Ft
$247/Sq Ft
Est. Value
About This Home
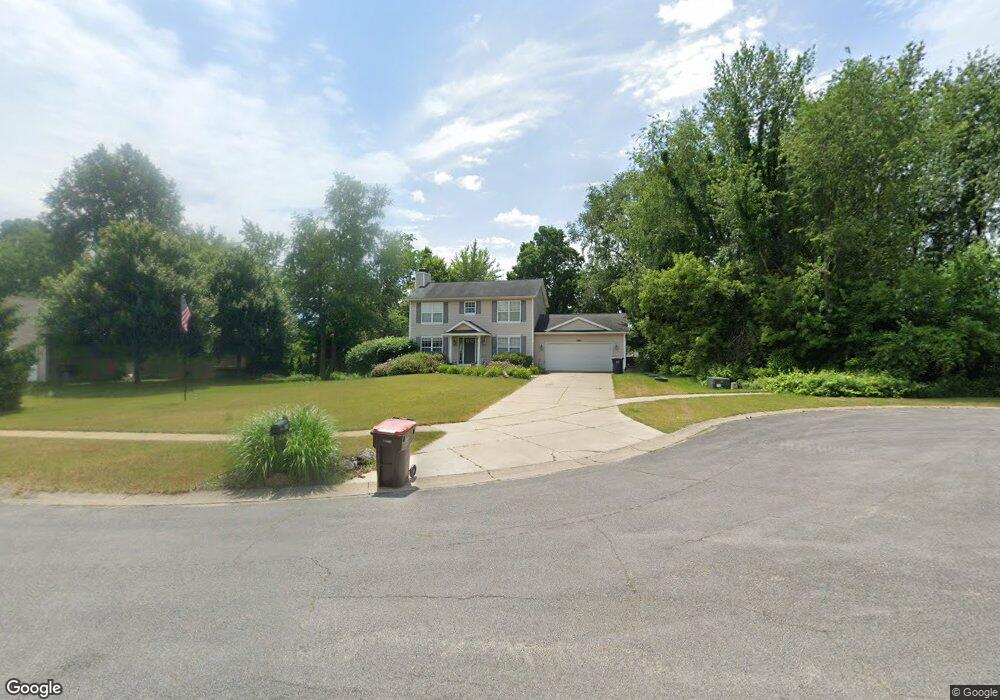
This home is located at 1664 Creston Dr, Dorr, MI 49323 and is currently estimated at $399,578, approximately $246 per square foot. 1664 Creston Dr is a home located in Allegan County with nearby schools including Wayland High School, Byron Center Charter School, and Moline Christian School.
Ownership History
Date
Name
Owned For
Owner Type
Purchase Details
Closed on
Oct 17, 2006
Sold by
Abn Amro Mortgage Group Inc and Clark Kade
Bought by
Harth Shane and Harth Rachel
Current Estimated Value
Home Financials for this Owner
Home Financials are based on the most recent Mortgage that was taken out on this home.
Original Mortgage
$131,100
Outstanding Balance
$77,884
Interest Rate
6.38%
Mortgage Type
Purchase Money Mortgage
Estimated Equity
$321,694
Purchase Details
Closed on
Jun 1, 2006
Sold by
Zuiderveen Beth
Bought by
Abn Amro Mortgage Group Inc
Purchase Details
Closed on
Jul 13, 2001
Sold by
Zuiderveen Jeffrey and Zuiderveen Beth Marie
Bought by
Zuiderveen Jeffrey and Zuiderveen Beth Marie
Home Financials for this Owner
Home Financials are based on the most recent Mortgage that was taken out on this home.
Original Mortgage
$134,320
Interest Rate
7.16%
Purchase Details
Closed on
Jan 26, 2000
Bought by
West Lake Homes
Create a Home Valuation Report for This Property
The Home Valuation Report is an in-depth analysis detailing your home's value as well as a comparison with similar homes in the area
Home Values in the Area
Average Home Value in this Area
Purchase History
We collect this data history from publicly available records. To have your information removed, we recommend requesting removal directly through your county’s website.
| Date | Buyer | Sale Price | Title Company |
|---|---|---|---|
| Harth Shane | $163,900 | None Available | |
| Abn Amro Mortgage Group Inc | $213,982 | None Available | |
| Zuiderveen Jeffrey | -- | Beltine Title Company Inc | |
| Zuiderveen Jeffrey | $167,900 | Beltline Title Company Inc | |
| West Lake Homes | $30,000 | -- |
Source: Public Records
Mortgage History
We collect this data history from publicly available records. To have your information removed, we recommend requesting removal directly through your county’s website.
| Date | Status | Borrower | Loan Amount |
|---|---|---|---|
| Open | Harth Shane | $131,100 | |
| Previous Owner | Zuiderveen Jeffrey | $134,320 |
Source: Public Records
Tax History
| Year | Tax Paid | Tax Assessment Tax Assessment Total Assessment is a certain percentage of the fair market value that is determined by local assessors to be the total taxable value of land and additions on the property. | Land | Improvement |
|---|---|---|---|---|
| 2025 | $3,943 | $174,800 | $35,100 | $139,700 |
| 2024 | $2,842 | $172,300 | $32,900 | $139,400 |
| 2023 | $2,911 | $150,400 | $31,000 | $119,400 |
| 2022 | $2,842 | $132,300 | $27,900 | $104,400 |
| 2021 | $2,673 | $119,300 | $27,900 | $91,400 |
| 2020 | $2,544 | $117,500 | $26,600 | $90,900 |
| 2019 | $2,544 | $106,700 | $23,100 | $83,600 |
| 2018 | $2,487 | $100,900 | $15,500 | $85,400 |
| 2017 | $0 | $103,600 | $15,500 | $88,100 |
| 2016 | $0 | $85,200 | $15,500 | $69,700 |
| 2015 | -- | $85,200 | $15,500 | $69,700 |
| 2014 | -- | $77,800 | $15,500 | $62,300 |
| 2013 | -- | $74,800 | $15,500 | $59,300 |
Source: Public Records
Map
Nearby Homes
- 1684 Ann St
- 4317 Saturn Dr
- 1691 Stratford Ave
- 1341 142nd Ave
- 0 V L 142nd Ave
- Lots A&B 142nd Ave
- 4092 Arndt Ct
- 4096 Janet Dr
- Lot 11 Walnut Dale Dr
- 4776 18th St SW
- 1164 144th Ave
- 1131 Glasgow Ave
- 1130 Fulham Ct
- V/L Parcel B 18th St
- V/L Parcel A 18th St
- 4285 Highpoint Dr Unit 108
- 4273 Highpoint Dr Unit 112
- 4269 Highpoint Dr Unit 114
- 4294 Highpoint Dr Unit 103
- 1069 Sunnyside Dr
- 1660 Creston Dr
- 1663 Karen Dr
- 1670 Creston Dr
- 1667 Karen Dr
- 1658 Creston Dr
- 1671 Creston Dr
- 1659 Karen Dr
- 4360 Pleasantview Ln
- 4360 Pleasentview Ln
- 4359 Pleasentview Ln
- 1671 Karen Dr
- 4350 Tracy Trail
- 4359 Pleasantview Ln
- 4346 Tracy Trail
- 4364 Pleasentview Ln
- 4354 Tracy Trail
- 4363 Pleasentview Ln
- 4360 Tracy Trail
- 1662 Karen Dr
- 1679 Karen Dr
Your Personal Tour Guide
Ask me questions while you tour the home.