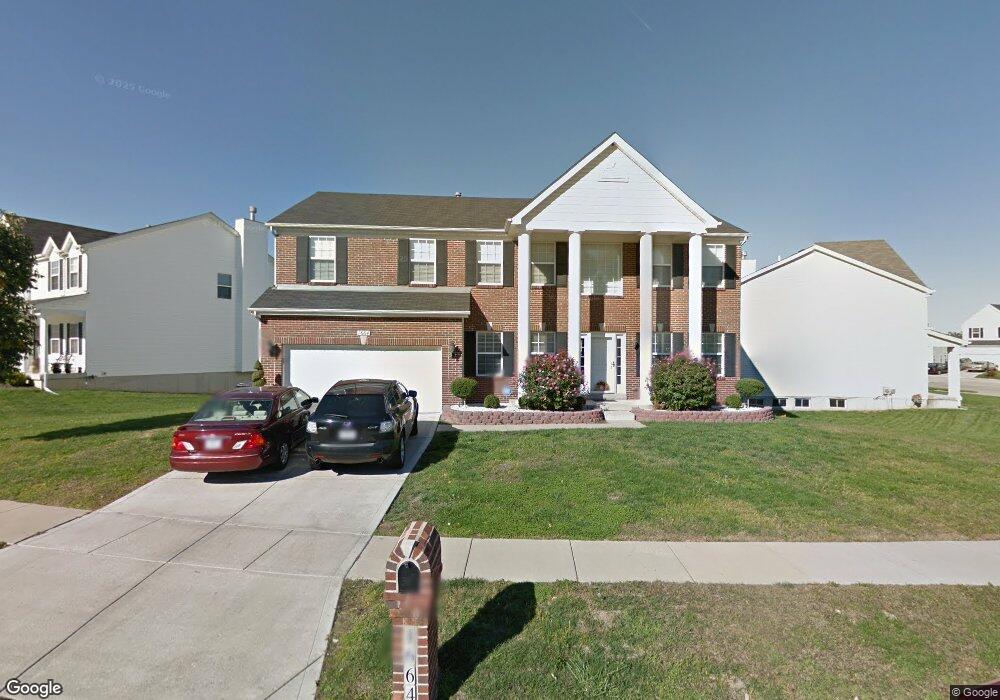
1664 Emerald Creek Dr Florissant, MO 63031
Estimated Value: $375,927 - $447,000
4
Beds
3
Baths
3,229
Sq Ft
$131/Sq Ft
Est. Value
About This Home
This home is located at 1664 Emerald Creek Dr, Florissant, MO 63031 and is currently estimated at $423,232, approximately $131 per square foot. 1664 Emerald Creek Dr is a home located in St. Louis County with nearby schools including Cold Water Elementary School, North Middle School, and Hazelwood Central High School.
Ownership History
Date
Name
Owned For
Owner Type
Purchase Details
Closed on
Jul 18, 2012
Sold by
Dailey Trishana Dione
Bought by
Jones Marvis M and Jones Randy Lee
Current Estimated Value
Purchase Details
Closed on
Jul 2, 2010
Sold by
Dailey William Earl
Bought by
Dailey Trishana Dione
Purchase Details
Closed on
Jun 15, 2006
Sold by
Dailey William E and Dailey Trishana D
Bought by
Dailey William E and Dailey Trishana D
Home Financials for this Owner
Home Financials are based on the most recent Mortgage that was taken out on this home.
Original Mortgage
$64,600
Interest Rate
6.56%
Mortgage Type
New Conventional
Purchase Details
Closed on
May 26, 2006
Sold by
The Jones Co Homes Llc
Bought by
Dailey William E and Dailey Trishana D
Home Financials for this Owner
Home Financials are based on the most recent Mortgage that was taken out on this home.
Original Mortgage
$64,600
Interest Rate
6.56%
Mortgage Type
New Conventional
Create a Home Valuation Report for This Property
The Home Valuation Report is an in-depth analysis detailing your home's value as well as a comparison with similar homes in the area
Home Values in the Area
Average Home Value in this Area
Purchase History
| Date | Buyer | Sale Price | Title Company |
|---|---|---|---|
| Jones Marvis M | $180,000 | Investors Title Co Clayton | |
| Dailey Trishana Dione | -- | None Available | |
| Dailey William E | -- | Pulaski Title Company | |
| Dailey William E | $323,141 | Pulaski Title Company |
Source: Public Records
Mortgage History
| Date | Status | Borrower | Loan Amount |
|---|---|---|---|
| Previous Owner | Dailey William E | $64,600 | |
| Previous Owner | Dailey William E | $258,512 |
Source: Public Records
Tax History Compared to Growth
Tax History
| Year | Tax Paid | Tax Assessment Tax Assessment Total Assessment is a certain percentage of the fair market value that is determined by local assessors to be the total taxable value of land and additions on the property. | Land | Improvement |
|---|---|---|---|---|
| 2025 | $5,373 | $66,400 | $7,350 | $59,050 |
| 2024 | $5,373 | $61,810 | $4,260 | $57,550 |
| 2023 | $5,373 | $61,810 | $4,260 | $57,550 |
| 2022 | $4,982 | $51,130 | $4,260 | $46,870 |
| 2021 | $4,910 | $51,130 | $4,260 | $46,870 |
| 2020 | $4,799 | $46,530 | $7,350 | $39,180 |
| 2019 | $4,726 | $46,530 | $7,350 | $39,180 |
| 2018 | $4,649 | $42,100 | $4,900 | $37,200 |
| 2017 | $4,644 | $42,100 | $4,900 | $37,200 |
| 2016 | $4,335 | $38,750 | $2,950 | $35,800 |
| 2015 | $4,242 | $38,750 | $2,950 | $35,800 |
| 2014 | $3,615 | $33,990 | $11,630 | $22,360 |
Source: Public Records
Map
Nearby Homes
- 1245 Leisure Dr
- 2906 Russet Ct
- 2916 Corn Silk Ct
- 2540 Courtyard Place
- 2455 S Park Ln
- 1920 Shackelford Rd
- 1290 Jackson Ln
- 2465 Grants Pkwy
- 2530 Grants Pkwy
- 1831 New Sun Ct Unit 5
- 1830 New Sun Ct
- 2040 Splendor Dr
- 2112 New Sun Dr
- 3035 Matlock Dr
- 2255 Collier Dr
- 2186 Aristocrat Dr
- 2106 Kingsford Dr
- 1863 High Sun Dr Unit 51863
- 2314 Stoney End Ct
- 1885 High Sun Dr
- 1656 Emerald Creek Dr
- 1684 Emerald Creek Dr
- 1710 Emerald Creek Dr
- 1652 Emerald Creek Dr
- 1718 Emerald Creek Dr
- 1657 Emerald Creek Dr
- 1661 Emerald Creek Dr
- 1673 Emerald Creek Dr
- 1653 Emerald Creek Dr
- 1669 Emerald Creek Dr
- 1681 Emerald Creek Dr
- 1665 Emerald Creek Dr
- 1722 Emerald Creek Dr
- 1648 Emerald Creek Dr
- 1649 Emerald Creek Dr
- 1685 Emerald Creek Dr
- 1711 Emerald Creek Dr
- 1726 Emerald Creek Dr
- 1707 Emerald Creek Dr
- 1645 Emerald Creek Dr