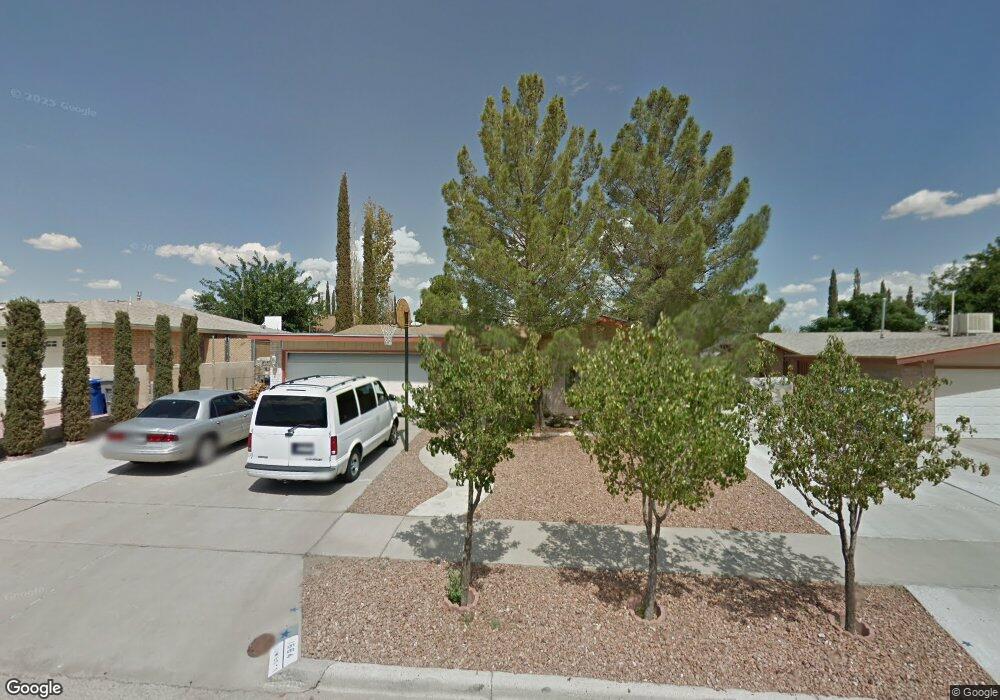
1664 Lou Graham St El Paso, TX 79936
Vista Hills NeighborhoodEstimated Value: $222,822 - $226,000
3
Beds
2
Baths
1,537
Sq Ft
$146/Sq Ft
Est. Value
About This Home
This home is located at 1664 Lou Graham St, El Paso, TX 79936 and is currently estimated at $223,706, approximately $145 per square foot. 1664 Lou Graham St is a home located in El Paso County with nearby schools including Tierra Del Sol Elementary School, J M Hanks High School, and EL PASO LEADERSHIP ACADEMY - MIDDLE EAST.
Ownership History
Date
Name
Owned For
Owner Type
Purchase Details
Closed on
Aug 21, 2025
Sold by
Romero Jose Manuel and Romero Melanie Valles
Bought by
Chuca Anastasia
Current Estimated Value
Home Financials for this Owner
Home Financials are based on the most recent Mortgage that was taken out on this home.
Original Mortgage
$219,206
Outstanding Balance
$219,016
Interest Rate
6.72%
Estimated Equity
$4,690
Purchase Details
Closed on
Jun 19, 2006
Sold by
Espinosa Pat Reyes and Espinosa Pat
Bought by
Romero Jose Manuel and Romero Melanie Valles
Home Financials for this Owner
Home Financials are based on the most recent Mortgage that was taken out on this home.
Original Mortgage
$25,900
Interest Rate
6.58%
Mortgage Type
Unknown
Purchase Details
Closed on
Oct 5, 1995
Sold by
Hockett Paul C and Hockett Linda D
Bought by
Espinosa George and Espinosa Pat
Create a Home Valuation Report for This Property
The Home Valuation Report is an in-depth analysis detailing your home's value as well as a comparison with similar homes in the area
Home Values in the Area
Average Home Value in this Area
Purchase History
| Date | Buyer | Sale Price | Title Company |
|---|---|---|---|
| Chuca Anastasia | -- | None Listed On Document | |
| Chuca Anastasia | -- | None Listed On Document | |
| Romero Jose Manuel | -- | None Available | |
| Romero Jose Manuel | -- | None Available | |
| Espinosa George | -- | -- | |
| Espinosa George | -- | -- |
Source: Public Records
Mortgage History
| Date | Status | Borrower | Loan Amount |
|---|---|---|---|
| Open | Chuca Anastasia | $219,206 | |
| Closed | Chuca Anastasia | $219,206 | |
| Previous Owner | Romero Jose Manuel | $25,900 |
Source: Public Records
Tax History Compared to Growth
Tax History
| Year | Tax Paid | Tax Assessment Tax Assessment Total Assessment is a certain percentage of the fair market value that is determined by local assessors to be the total taxable value of land and additions on the property. | Land | Improvement |
|---|---|---|---|---|
| 2025 | $3,416 | $208,263 | -- | -- |
| 2024 | $3,416 | $189,330 | -- | -- |
| 2023 | $3,416 | $172,118 | $0 | $0 |
| 2022 | $4,859 | $156,471 | $0 | $0 |
| 2021 | $4,624 | $142,246 | $19,576 | $122,670 |
| 2020 | $4,589 | $145,294 | $19,576 | $125,718 |
| 2018 | $4,374 | $140,642 | $19,576 | $121,066 |
| 2017 | $4,025 | $131,665 | $19,576 | $112,089 |
| 2016 | $4,025 | $131,665 | $19,576 | $112,089 |
| 2015 | $3,187 | $131,665 | $19,576 | $112,089 |
| 2014 | $3,187 | $133,203 | $19,576 | $113,627 |
Source: Public Records
Map
Nearby Homes
- 1664 Dick Ritter St
- 11268 Enid Wilson Ln
- 11262 Enid Wilson Ln
- 1628 Bert Green Dr
- 1624 Lou Graham Dr
- 1607 Tommy Aaron Dr
- 1617 Tommy Aaron Dr
- 11204 Bob Mitchell Dr
- 1605 Larry Wadkins Dr
- 1703 Robert Wynn St
- 1700 Jerry Abbott St
- 11452 Jim Ferriell Dr
- 11470 Ed Merrins Dr
- 11157 Leo Collins Dr
- 3655 George Dieter Dr
- 1739 Jerry Abbott St
- 1804 Jerry Abbott St
- 11531 Meadowbrook Dr
- 11506 James Grant Dr
- 1639 Brian Ray Cir
- 1668 Lou Graham St
- 1660 Lou Graham St
- 1665 Bert Green Dr
- 1661 Bert Green Dr
- 1669 Bert Green Dr
- 1656 Lou Graham St
- 1672 Lou Graham St
- 1665 Lou Graham St
- 1657 Bert Green Dr
- 1661 Lou Graham St
- 1669 Lou Graham St
- 1675 Bert Green Dr
- 1657 Lou Graham St
- 1652 Lou Graham St
- 1657 Lou Graham Dr
- 1673 Lou Graham St
- 1653 Bert Green Dr
- 1660 Dick Ritter Dr
- 1653 Lou Graham St
- 1664 Bert Green Dr