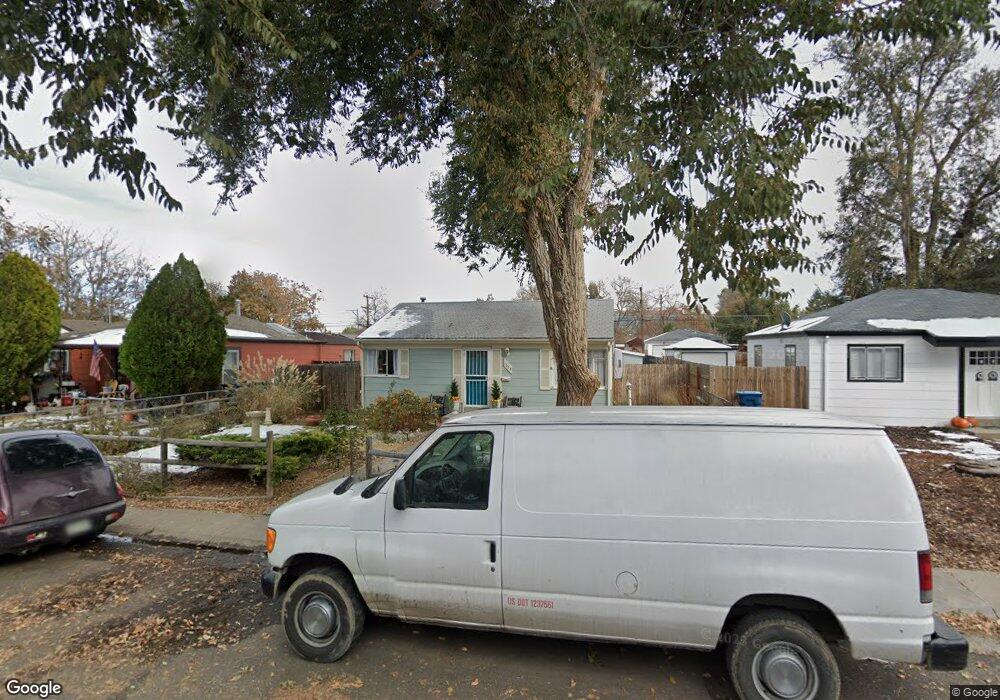
1664 Newark St Aurora, CO 80010
North Aurora NeighborhoodEstimated Value: $325,000 - $356,000
2
Beds
1
Bath
720
Sq Ft
$468/Sq Ft
Est. Value
About This Home
This home is located at 1664 Newark St, Aurora, CO 80010 and is currently estimated at $337,074, approximately $468 per square foot. 1664 Newark St is a home located in Adams County with nearby schools including Crawford Elementary School, North Middle School Health Sciences & Technology, and Aurora Central High School.
Ownership History
Date
Name
Owned For
Owner Type
Purchase Details
Closed on
Apr 18, 2003
Sold by
Hulsey Lutz Erlene M
Bought by
Woodward Robert G
Current Estimated Value
Home Financials for this Owner
Home Financials are based on the most recent Mortgage that was taken out on this home.
Original Mortgage
$238,500
Outstanding Balance
$98,014
Interest Rate
5.64%
Estimated Equity
$239,060
Create a Home Valuation Report for This Property
The Home Valuation Report is an in-depth analysis detailing your home's value as well as a comparison with similar homes in the area
Home Values in the Area
Average Home Value in this Area
Purchase History
| Date | Buyer | Sale Price | Title Company |
|---|---|---|---|
| Woodward Robert G | $265,000 | -- |
Source: Public Records
Mortgage History
| Date | Status | Borrower | Loan Amount |
|---|---|---|---|
| Open | Woodward Robert G | $238,500 |
Source: Public Records
Tax History
| Year | Tax Paid | Tax Assessment Tax Assessment Total Assessment is a certain percentage of the fair market value that is determined by local assessors to be the total taxable value of land and additions on the property. | Land | Improvement |
|---|---|---|---|---|
| 2025 | $1,340 | $22,370 | $5,440 | $16,930 |
| 2024 | $1,340 | $20,560 | $5,000 | $15,560 |
| 2023 | $1,362 | $23,270 | $5,210 | $18,060 |
| 2022 | $1,320 | $18,570 | $5,350 | $13,220 |
| 2021 | $1,376 | $18,570 | $5,350 | $13,220 |
| 2020 | $1,439 | $19,340 | $5,510 | $13,830 |
| 2019 | $2,278 | $19,340 | $5,510 | $13,830 |
| 2018 | $1,557 | $13,160 | $4,320 | $8,840 |
| 2017 | $1,383 | $13,160 | $4,320 | $8,840 |
| 2016 | $735 | $6,940 | $2,390 | $4,550 |
| 2015 | $712 | $6,940 | $2,390 | $4,550 |
| 2014 | -- | $6,250 | $2,390 | $3,860 |
Source: Public Records
Map
Nearby Homes
- 1680 Newark St
- 1764 Newark St
- 1605 Oakland St
- 1671 Oswego St
- 1781 N Oakland St
- 1945 Nome St
- 1732 Lansing St
- 1764 Oswego St
- 1400 Lima St
- 1902 Kenton St
- 11916 E 14th Ave
- 2045 Lima St
- 1341 Lima St
- 11087 Montview Blvd
- 1741 Joliet St
- 2209 Macon St
- 1273 Newark St
- 1450 Joliet St
- 1745 Jamaica St
- 1446 Jamaica St
Your Personal Tour Guide
Ask me questions while you tour the home.