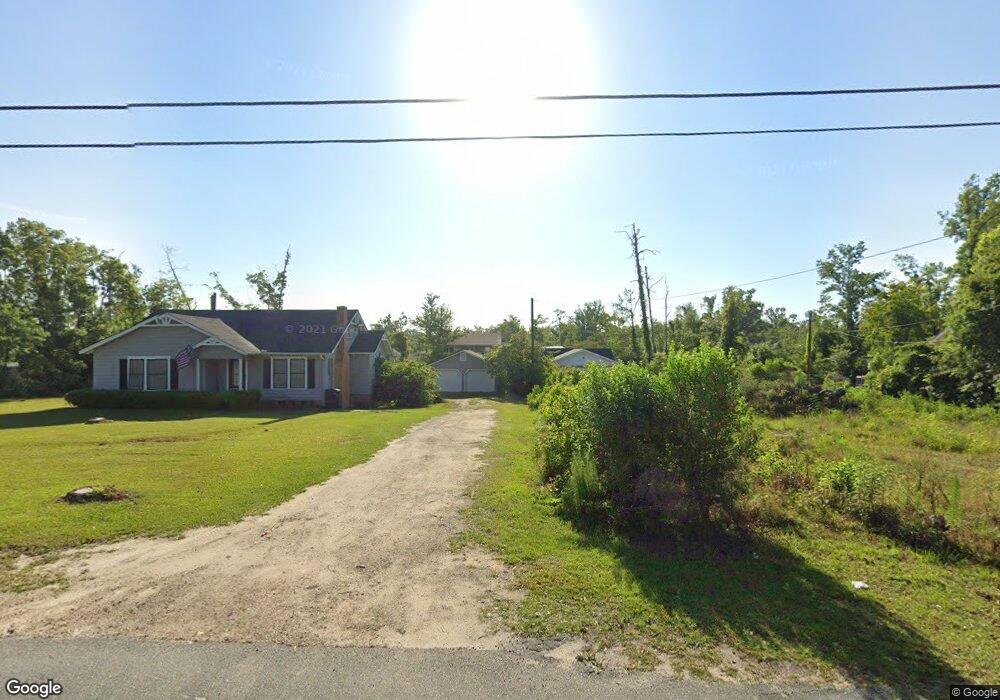
16643 SW Gaskin St Blountstown, FL 32424
Estimated Value: $251,000 - $572,000
4
Beds
3
Baths
3,659
Sq Ft
$116/Sq Ft
Est. Value
About This Home
This home is located at 16643 SW Gaskin St, Blountstown, FL 32424 and is currently estimated at $423,514, approximately $115 per square foot. 16643 SW Gaskin St is a home located in Calhoun County.
Ownership History
Date
Name
Owned For
Owner Type
Purchase Details
Closed on
Dec 7, 2022
Sold by
Bels Group Inc
Bought by
Blackburn Michael T and Blackburn Brandalyn L
Current Estimated Value
Home Financials for this Owner
Home Financials are based on the most recent Mortgage that was taken out on this home.
Original Mortgage
$320,000
Outstanding Balance
$307,000
Interest Rate
5.25%
Mortgage Type
New Conventional
Estimated Equity
$116,514
Purchase Details
Closed on
Oct 19, 2021
Sold by
Residuary Credit Shelter Trust
Bought by
Bels Group Inc
Purchase Details
Closed on
Aug 6, 2021
Sold by
Carlton Vanlierop
Bought by
Vanlierop Carlton
Purchase Details
Closed on
Apr 30, 2021
Sold by
Vanlierop Annie L and The Residuary Credit Shelter T
Bought by
Bels Group Inc
Home Financials for this Owner
Home Financials are based on the most recent Mortgage that was taken out on this home.
Original Mortgage
$100,000
Interest Rate
3%
Mortgage Type
Land Contract Argmt. Of Sale
Create a Home Valuation Report for This Property
The Home Valuation Report is an in-depth analysis detailing your home's value as well as a comparison with similar homes in the area
Home Values in the Area
Average Home Value in this Area
Purchase History
| Date | Buyer | Sale Price | Title Company |
|---|---|---|---|
| Blackburn Michael T | $400,000 | -- | |
| Bels Group Inc | $100 | Calhoun Liberty Abstract | |
| Vanlierop Carlton | $100 | Summers Jackson | |
| Carlton Vanlierop | $100 | Summers Jackson | |
| Bels Group Inc | $140,000 | Calhoun Liberty Abstract Co |
Source: Public Records
Mortgage History
| Date | Status | Borrower | Loan Amount |
|---|---|---|---|
| Open | Blackburn Michael T | $320,000 | |
| Previous Owner | Bels Group Inc | $100,000 |
Source: Public Records
Tax History Compared to Growth
Tax History
| Year | Tax Paid | Tax Assessment Tax Assessment Total Assessment is a certain percentage of the fair market value that is determined by local assessors to be the total taxable value of land and additions on the property. | Land | Improvement |
|---|---|---|---|---|
| 2024 | $4,819 | $340,574 | -- | -- |
| 2023 | $4,819 | $330,654 | $0 | $0 |
| 2022 | $2,146 | $126,157 | $39,384 | $86,773 |
| 2021 | $1,189 | $110,631 | $39,383 | $71,248 |
| 2020 | $1,198 | $110,631 | $39,383 | $71,248 |
| 2019 | $546 | $68,324 | $39,383 | $28,941 |
| 2018 | $3,287 | $225,479 | $39,383 | $186,096 |
| 2017 | $3,261 | $223,010 | $0 | $0 |
| 2016 | $3,221 | $218,423 | $0 | $0 |
| 2015 | -- | $216,905 | $0 | $0 |
| 2014 | -- | $215,184 | $0 | $0 |
Source: Public Records
Map
Nearby Homes
- 16619 SW Gaskin St
- 16590 Gaskin St
- TBD Florida 71
- 16500 SE Pear St
- XX2 Tupelo Ave
- 20777 SE Fannin Ave
- 0 Florida 71 Unit Lots 46 & 47 657795
- 16302 SW Mimosa St
- 20077 W Central Ave
- 19974 SW Sherry Ave
- 20994 SE Martin Luther King Ave
- TBD Sr 20 W and 10th St
- 25541 Pennington Ave
- TBD Chipola Rd
- 517 Gadsden St
- 16079 SE Janet St
- 20158 NW Evans Ave
- 15985 State Road 71 S
- 17517 NE Teresa Terrace St
- 20163 Marie Ave
- 16619 Gaskin Still Rd
- 20530 SW Sherry Ave
- 16681 SW Gaskin St
- 16607 SW Gaskin St
- 16713 SW Gaskin St
- 16587 SW Gaskin St
- 16640 SW Gaskin St
- 16620 SW Gaskin St
- 16642 SW Gaskin St
- 16606 SW Gaskin St
- 16676 SW Gaskin St
- 16567 SW Gaskin St
- 17054 Main St S
- 16696 SW Gaskin St
- 16729 SW Gaskin St
- 16708 SW Gaskin St
- 16723 SW Warren St
- 16558 SW Gaskin St
- 16705 SW Mimosa St
- 16659 SW Mimosa St