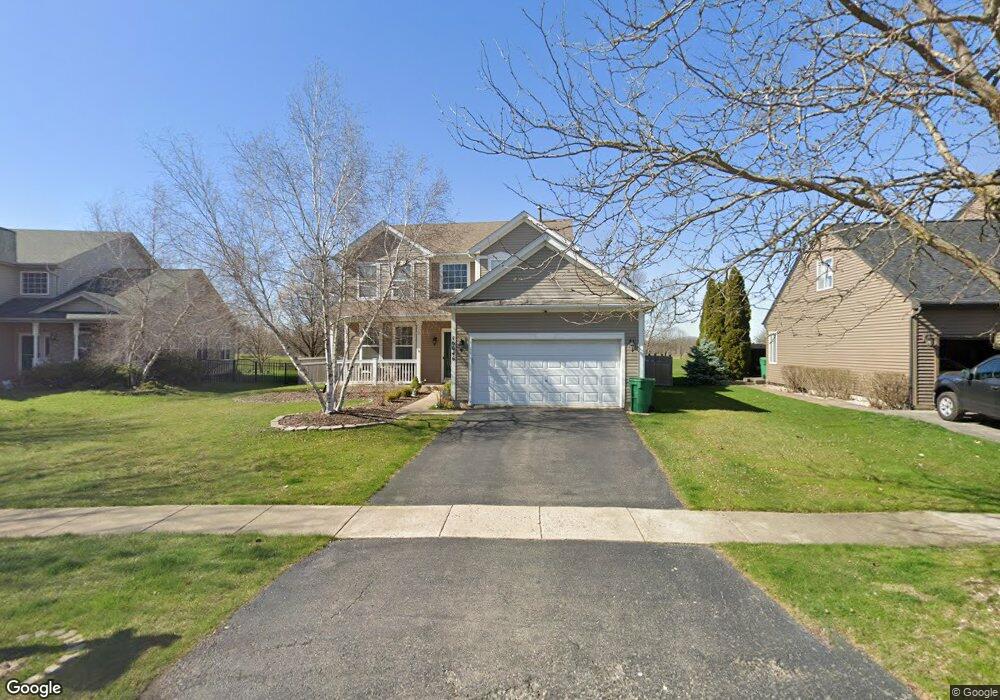
16646 W Apache Dr Lockport, IL 60441
Estimated Value: $414,000 - $443,000
3
Beds
4
Baths
2,600
Sq Ft
$165/Sq Ft
Est. Value
About This Home
This home is located at 16646 W Apache Dr, Lockport, IL 60441 and is currently estimated at $430,084, approximately $165 per square foot. 16646 W Apache Dr is a home located in Will County with nearby schools including William J. Butler, Hadley Middle School, and Homer Jr High School.
Ownership History
Date
Name
Owned For
Owner Type
Purchase Details
Closed on
Jan 9, 2006
Sold by
Lane Brian E and Lane Elizabeth F
Bought by
Formella Victor and Formella Nadejda
Current Estimated Value
Home Financials for this Owner
Home Financials are based on the most recent Mortgage that was taken out on this home.
Original Mortgage
$253,600
Outstanding Balance
$143,805
Interest Rate
6.42%
Mortgage Type
Fannie Mae Freddie Mac
Estimated Equity
$286,279
Purchase Details
Closed on
Aug 1, 2000
Sold by
Centex Homes
Bought by
Lane Brian E and Lane Elizabeth F
Home Financials for this Owner
Home Financials are based on the most recent Mortgage that was taken out on this home.
Original Mortgage
$223,200
Interest Rate
8.16%
Create a Home Valuation Report for This Property
The Home Valuation Report is an in-depth analysis detailing your home's value as well as a comparison with similar homes in the area
Home Values in the Area
Average Home Value in this Area
Purchase History
| Date | Buyer | Sale Price | Title Company |
|---|---|---|---|
| Formella Victor | $317,000 | Chicago Title Insurance Co | |
| Lane Brian E | $244,500 | Chicago Title Insurance Co |
Source: Public Records
Mortgage History
| Date | Status | Borrower | Loan Amount |
|---|---|---|---|
| Open | Formella Victor | $253,600 | |
| Previous Owner | Lane Brian E | $223,200 |
Source: Public Records
Tax History Compared to Growth
Tax History
| Year | Tax Paid | Tax Assessment Tax Assessment Total Assessment is a certain percentage of the fair market value that is determined by local assessors to be the total taxable value of land and additions on the property. | Land | Improvement |
|---|---|---|---|---|
| 2024 | $9,959 | $121,725 | $25,999 | $95,726 |
| 2023 | $9,959 | $110,338 | $23,567 | $86,771 |
| 2022 | $9,550 | $92,977 | $20,375 | $72,602 |
| 2021 | $7,809 | $88,088 | $19,304 | $68,784 |
| 2020 | $7,775 | $84,847 | $18,594 | $66,253 |
| 2019 | $7,477 | $81,622 | $17,887 | $63,735 |
| 2018 | $7,320 | $78,851 | $17,682 | $61,169 |
| 2017 | $7,203 | $90,229 | $17,187 | $73,042 |
| 2016 | $8,401 | $87,220 | $16,614 | $70,606 |
| 2015 | $8,239 | $83,946 | $15,990 | $67,956 |
| 2014 | $8,239 | $82,212 | $15,660 | $66,552 |
| 2013 | $8,239 | $82,212 | $15,660 | $66,552 |
Source: Public Records
Map
Nearby Homes
- 17259 Long Bow Dr
- 17237 Arrow Head Dr
- 16613 W Adobe Dr
- 17053 Mendota Dr
- 17009 Mendota Dr
- 17437 Yakima Dr
- 17213 Mendota Dr
- 17113 Manitoba
- 17129 Manitoba St
- 15880 W Bruce Rd
- 17040 Cheyenne Ct
- 16530 Willow Walk Dr
- 16212 Golfview Dr
- 16559 Willow Walk Dr
- 17120 Carlislie Ln
- 17228 Como Ave
- 17543 S Gilbert Dr
- 16047 Tiger Dr
- 16043 Tiger Dr
- 1105 E Division St Unit 1B
- 16642 W Apache Dr
- 16650 W Apache Dr
- 16654 W Apache Dr
- 16647 W Apache Dr
- 16651 W Apache Dr
- 16634 W Apache Dr
- 16639 W Apache Dr
- 16658 W Apache Dr
- 16657 W Apache Dr
- 16633 W Apache Dr
- 16630 W Apache Dr
- 16662 W Apache Dr
- 16550 W Montauk Dr
- 16661 W Apache Dr
- 16542 W Montauk Dr
- 16629 W Apache Dr
- 16658 W Montauk Dr
- 16626 W Apache Dr
- 16700 W Apache Dr
- 16536 W Montauk Dr