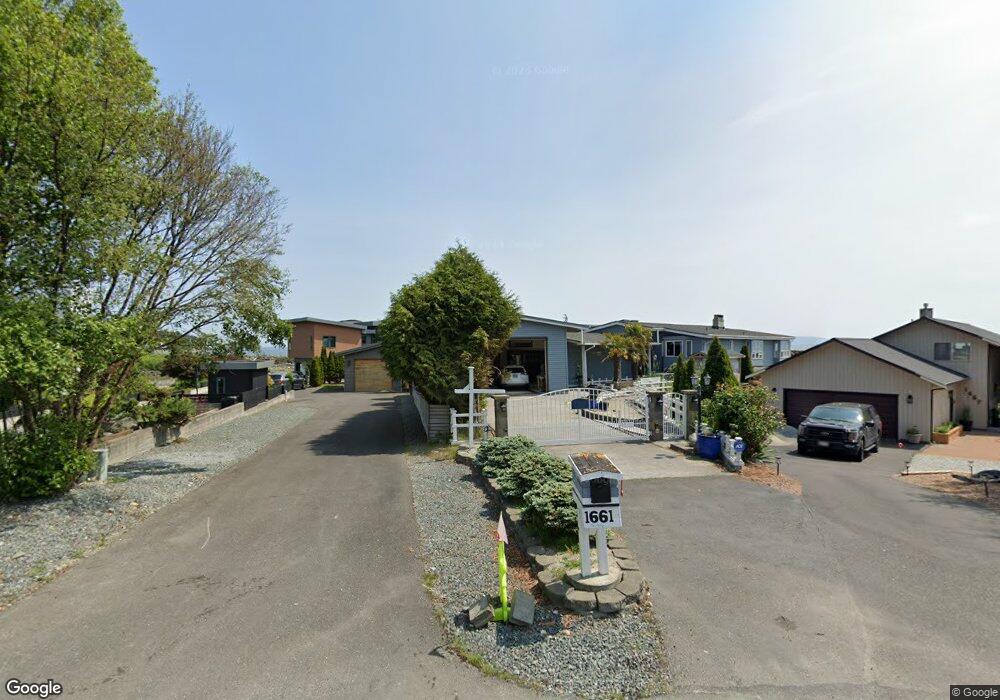
1665 Edwards Dr Point Roberts, WA 98281
Estimated Value: $1,364,000 - $1,680,000
4
Beds
3
Baths
3,907
Sq Ft
$388/Sq Ft
Est. Value
About This Home
This home is located at 1665 Edwards Dr, Point Roberts, WA 98281 and is currently estimated at $1,517,750, approximately $388 per square foot. 1665 Edwards Dr is a home with nearby schools including Point Roberts Primary School, Blaine Middle School, and Blaine High School.
Ownership History
Date
Name
Owned For
Owner Type
Purchase Details
Closed on
Mar 21, 2011
Sold by
Tuazon Jonathan and Tuazon Rosie
Bought by
Cantas Hector
Current Estimated Value
Purchase Details
Closed on
May 4, 2004
Sold by
Tuazon Jonathan
Bought by
Tuazon Jonathan and Tuazon Rosie
Home Financials for this Owner
Home Financials are based on the most recent Mortgage that was taken out on this home.
Original Mortgage
$206,250
Interest Rate
5.38%
Mortgage Type
Purchase Money Mortgage
Purchase Details
Closed on
Nov 8, 2001
Sold by
Prochaska Helmuth H and Prochaska Beverly R
Bought by
Dobb Bryan and Dobb Stephanie
Home Financials for this Owner
Home Financials are based on the most recent Mortgage that was taken out on this home.
Original Mortgage
$207,900
Interest Rate
6.67%
Mortgage Type
Seller Take Back
Create a Home Valuation Report for This Property
The Home Valuation Report is an in-depth analysis detailing your home's value as well as a comparison with similar homes in the area
Home Values in the Area
Average Home Value in this Area
Purchase History
| Date | Buyer | Sale Price | Title Company |
|---|---|---|---|
| Cantas Hector | $700,280 | First American Title Ins | |
| Tuazon Jonathan | -- | Whatcom Land Title | |
| Tuazon Jonathan | -- | Whatcom Land Title | |
| Tuazon Jonathan | $275,000 | Whatcom Land Title | |
| Dobb Bryan | -- | Chicago Title Insurance |
Source: Public Records
Mortgage History
| Date | Status | Borrower | Loan Amount |
|---|---|---|---|
| Previous Owner | Tuazon Jonathan | $206,250 | |
| Previous Owner | Dobb Bryan | $207,900 |
Source: Public Records
Tax History Compared to Growth
Tax History
| Year | Tax Paid | Tax Assessment Tax Assessment Total Assessment is a certain percentage of the fair market value that is determined by local assessors to be the total taxable value of land and additions on the property. | Land | Improvement |
|---|---|---|---|---|
| 2024 | $11,341 | $1,540,035 | $853,690 | $686,345 |
| 2023 | $11,341 | $1,462,427 | $776,082 | $686,345 |
| 2022 | $10,281 | $1,335,549 | $708,750 | $626,799 |
| 2021 | $11,039 | $1,099,969 | $622,627 | $477,342 |
| 2020 | $10,961 | $1,099,969 | $622,627 | $477,342 |
| 2019 | $10,118 | $1,055,494 | $597,452 | $458,042 |
| 2018 | $10,365 | $949,812 | $537,632 | $412,180 |
| 2017 | $8,888 | $907,099 | $513,455 | $393,644 |
| 2016 | $9,857 | $880,679 | $498,500 | $382,179 |
| 2015 | $10,386 | $949,445 | $569,473 | $379,972 |
| 2014 | -- | $982,832 | $589,050 | $393,782 |
| 2013 | -- | $941,164 | $565,950 | $375,214 |
Source: Public Records
Map
Nearby Homes
- Lot 3 Edwards Dr
- 19 Harbor Seal Dr
- 1587 Harbor Seal Dr
- 1561 Edwards Dr
- 1920 Patos Way
- 1927 Orcas View Way
- 1477 Edwards Dr
- 1561 Ocean View Ln
- 1453 Edwards Dr
- 1881 Edwards Dr
- 0 Edwards Dr Unit Lot 2 11256474
- 698 Kendor Dr
- 634 S Beach Rd
- 661 Driftwood Ln
- 1934 Waters Rd
- 1911 Apa Rd
- 1940 Apa Rd
- 1438 Gulf Rd
- 675 Sylvia Dr
- 1542 Columbia Vista Dr
- 1661 Edwards Dr
- 1669 Edwards Dr
- 1657 Edwards Dr
- 1668 Harbor Seal Dr
- 1664 Harbor Seal Dr
- 1663 Harbor Seal Dr
- 1660 Harbor Seal Dr
- 1645 Edwards Dr
- 1656 Harbor Seal Dr
- 1641 Edwards Dr
- 1637 Edwards Dr
- 1636 Edwards Dr
- 1635 Harbor Seal Dr
- 1648 Harbor Seal Dr
- 1644 Harbor Seal Dr
- 1630 Edwards Dr
- 1631 Edwards Dr
- 1629 Harbor Seal Dr
- 1615 Edwards Dr
- 16 XX Edwards Dr