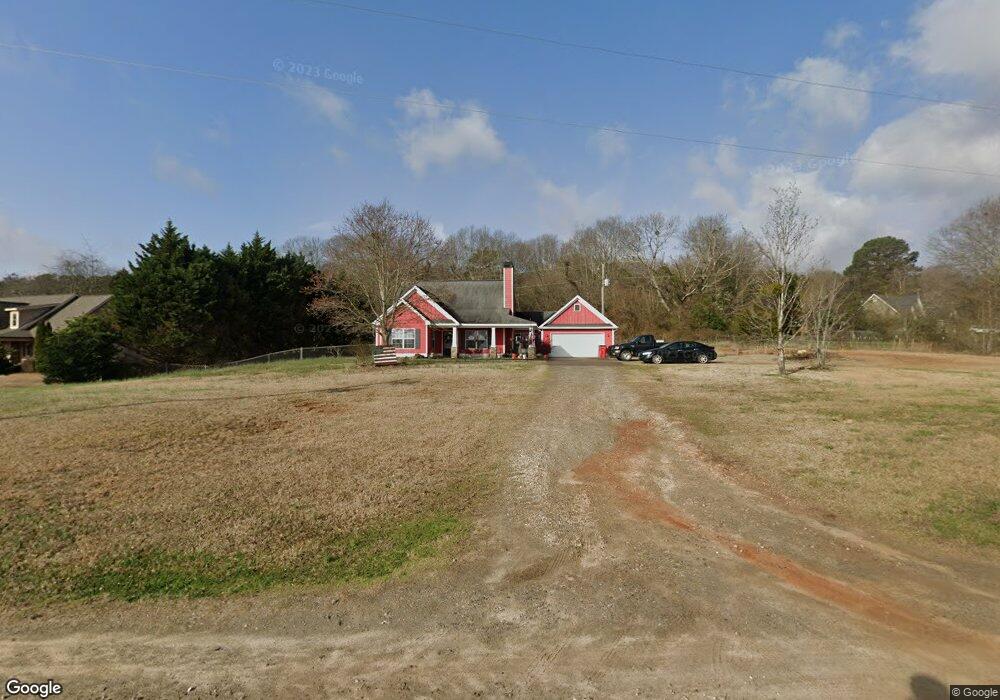
1665 Old Winder Jefferson Hwy Jefferson, GA 30549
Estimated Value: $383,436 - $436,000
--
Bed
2
Baths
1,774
Sq Ft
$232/Sq Ft
Est. Value
About This Home
This home is located at 1665 Old Winder Jefferson Hwy, Jefferson, GA 30549 and is currently estimated at $412,359, approximately $232 per square foot. 1665 Old Winder Jefferson Hwy is a home located in Jackson County with nearby schools including South Jackson Elementary School, East Jackson Middle School, and East Jackson Comprehensive High School.
Ownership History
Date
Name
Owned For
Owner Type
Purchase Details
Closed on
Oct 29, 2019
Sold by
Barton Michael Lewis
Bought by
Barton Tanya
Current Estimated Value
Purchase Details
Closed on
Jul 1, 2005
Sold by
Kenneth Mcdaniel Construction
Bought by
Barton Tanya and Barton Michael L
Home Financials for this Owner
Home Financials are based on the most recent Mortgage that was taken out on this home.
Original Mortgage
$137,800
Interest Rate
5.54%
Mortgage Type
New Conventional
Purchase Details
Closed on
Feb 16, 2005
Sold by
Sikes Dennis A
Bought by
Kenneth Mcdaniel Construction
Home Financials for this Owner
Home Financials are based on the most recent Mortgage that was taken out on this home.
Original Mortgage
$120,750
Interest Rate
5.61%
Mortgage Type
New Conventional
Create a Home Valuation Report for This Property
The Home Valuation Report is an in-depth analysis detailing your home's value as well as a comparison with similar homes in the area
Home Values in the Area
Average Home Value in this Area
Purchase History
| Date | Buyer | Sale Price | Title Company |
|---|---|---|---|
| Barton Tanya | -- | -- | |
| Barton Tanya | $172,300 | -- | |
| Barton Tanya | $172,300 | -- | |
| Kenneth Mcdaniel Construction | $26,000 | -- |
Source: Public Records
Mortgage History
| Date | Status | Borrower | Loan Amount |
|---|---|---|---|
| Previous Owner | Barton Tanya | $137,800 | |
| Previous Owner | Kenneth Mcdaniel Construction | $120,750 |
Source: Public Records
Tax History Compared to Growth
Tax History
| Year | Tax Paid | Tax Assessment Tax Assessment Total Assessment is a certain percentage of the fair market value that is determined by local assessors to be the total taxable value of land and additions on the property. | Land | Improvement |
|---|---|---|---|---|
| 2024 | $3,242 | $124,224 | $32,280 | $91,944 |
| 2023 | $3,219 | $114,440 | $32,280 | $82,160 |
| 2022 | $2,255 | $77,560 | $10,960 | $66,600 |
| 2021 | $2,271 | $77,560 | $10,960 | $66,600 |
| 2020 | $2,113 | $65,960 | $10,960 | $55,000 |
| 2019 | $2,145 | $65,960 | $10,960 | $55,000 |
| 2018 | $2,114 | $64,200 | $10,960 | $53,240 |
| 2017 | $1,842 | $55,474 | $9,330 | $46,144 |
| 2016 | $1,852 | $55,474 | $9,330 | $46,144 |
| 2015 | $1,849 | $55,474 | $9,330 | $46,144 |
| 2014 | $1,806 | $54,091 | $9,330 | $44,761 |
| 2013 | -- | $54,091 | $9,330 | $44,761 |
Source: Public Records
Map
Nearby Homes
- 2047 Old Winder Rd
- 1621 Old Winder Jefferson Hwy
- 284 Old Winder-Jefferson Hwy
- 0 Old Winder-Jefferson Hwy
- 720 Ebenezer Church Rd
- 714 Ebenezer Church Rd
- 1729 Old Winder Jefferson Hwy
- 779 Ebenezer Church Rd
- 886 Ebenezer Church Rd
- 1749 Old Winder Jefferson Hwy
- 910 Ebenezer Church Rd
- 605 605 Ebenezer Church Rd
- 1525 Old Winder Jefferson Hwy
- 559 559 Ebenezer Church Rd
- 559 Ebenezer Church Rd
- 933 Ebenezer Church Rd
- 958 Ebenezer Church Rd
- 160 Haskin Martin Rd
- 555 Ebenezer Church Rd
- 1860 Old Winder Jefferson Hwy