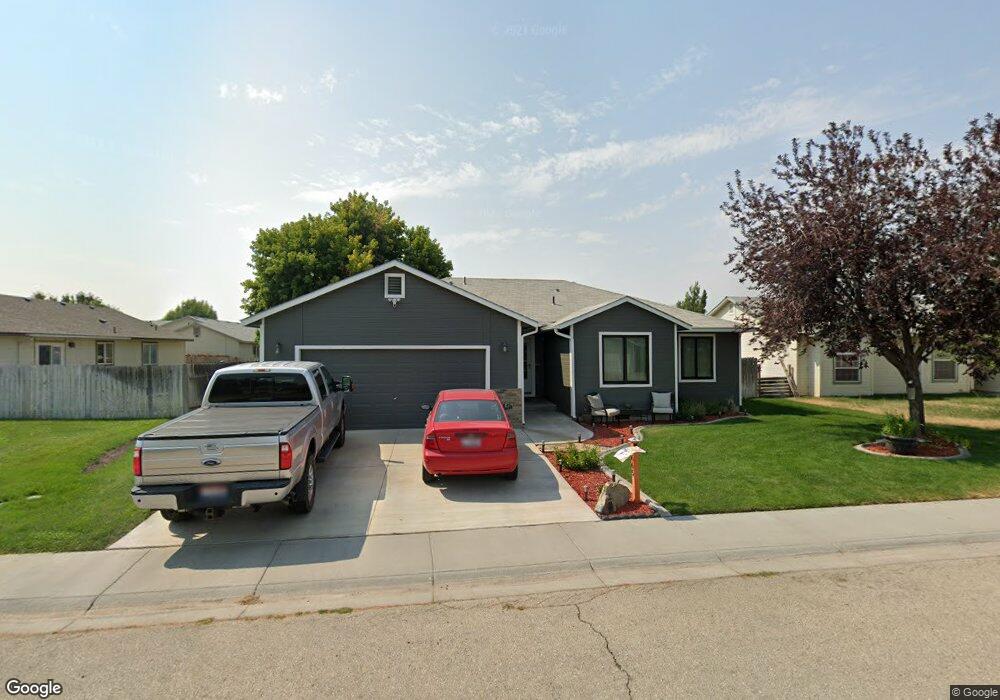
1665 Peregrine Dr Mountain Home, ID 83647
Estimated Value: $321,000 - $337,276
3
Beds
2
Baths
1,400
Sq Ft
$236/Sq Ft
Est. Value
About This Home
Property Id: 1191353
Welcome to this quiet and friendly neighborhood in SW Mountain Home. This house is located just 12 minutes from MHAFB and 10 minutes from the interstate. Great split floor plan with master on one side of the house and 3 rooms on the other. Amazing well kept yard both front and back- and sit back and enjoy this yard because summer yard maintenance is included in rent. Shared community playground located just around the block.
*City Utilities (water, sewer, trash and recycling) included in rent as well as summer yard maintenance.
*Tenant pays power, gas, internet, cable, etc and all associated fees.
Ownership History
Date
Name
Owned For
Owner Type
Purchase Details
Closed on
Jul 26, 2010
Sold by
Hegler Dale D
Bought by
Hegler Dale D
Current Estimated Value
Home Financials for this Owner
Home Financials are based on the most recent Mortgage that was taken out on this home.
Original Mortgage
$145,996
Outstanding Balance
$91,317
Interest Rate
3.5%
Mortgage Type
VA
Estimated Equity
$239,252
Purchase Details
Closed on
Mar 31, 2009
Sold by
Sedillos Albert A
Bought by
Hegler Dale D
Home Financials for this Owner
Home Financials are based on the most recent Mortgage that was taken out on this home.
Original Mortgage
$142,907
Interest Rate
5.04%
Mortgage Type
VA
Create a Home Valuation Report for This Property
The Home Valuation Report is an in-depth analysis detailing your home's value as well as a comparison with similar homes in the area
Home Values in the Area
Average Home Value in this Area
Purchase History
| Date | Buyer | Sale Price | Title Company |
|---|---|---|---|
| Hegler Dale D | -- | -- | |
| Hegler Dale D | -- | -- |
Source: Public Records
Mortgage History
| Date | Status | Borrower | Loan Amount |
|---|---|---|---|
| Open | Hegler Dale D | $145,996 | |
| Closed | Hegler Dale D | $142,907 |
Source: Public Records
Property History
| Date | Event | Price | List to Sale | Price per Sq Ft |
|---|---|---|---|---|
| 01/16/2025 01/16/25 | For Rent | $2,100 | -- | -- |
Tax History Compared to Growth
Tax History
| Year | Tax Paid | Tax Assessment Tax Assessment Total Assessment is a certain percentage of the fair market value that is determined by local assessors to be the total taxable value of land and additions on the property. | Land | Improvement |
|---|---|---|---|---|
| 2024 | $3,235 | $330,424 | $53,900 | $276,524 |
| 2023 | $3,235 | $324,947 | $41,800 | $283,147 |
| 2022 | $2,070 | $310,559 | $37,950 | $272,609 |
| 2021 | $1,687 | $229,606 | $31,680 | $197,926 |
| 2020 | $1,573 | $186,221 | $26,400 | $159,821 |
| 2019 | $1,638 | $165,221 | $26,400 | $138,821 |
| 2018 | $1,527 | $137,485 | $22,031 | $115,454 |
| 2017 | $1,497 | $129,545 | $22,031 | $107,514 |
| 2016 | $1,460 | $124,658 | $22,031 | $102,627 |
| 2015 | $1,340 | $0 | $0 | $0 |
| 2012 | -- | $86,586 | $25,918 | $60,668 |
Source: Public Records
Map
Nearby Homes
- 1120 NW Foster Dr
- 722 NW Date Ave
- 1879 N West Enterprise St
- 1224 NW Mandarin St
- 420 NW Heron Ave
- 995 NW Maggie Ct
- 508 W 2nd N
- 422 W 3rd N
- 850 Garrett St
- 410 Chestnut St
- 420 Oak Ct
- 1075 Teal Cir
- 885 Partridge Dr
- 910 Gregory Ln
- 1265 Eric Ct
- 165 Sagebrush Ave
- TBD W 7th S
- 405 N 2nd E
- 80 A St
- 127 E 8th N
- 1675 Peregrine Dr
- 1625 Peregrine Dr
- 1570 Peregrine Dr
- 1560 Peregrine Dr
- 1580 Peregrine Dr
- 1685 Peregrine Dr
- 1550 Peregrine Dr
- 1640 Peregrine Dr
- 1670 Peregrine Dr
- 1610 Peregrine Dr
- 1695 Peregrine Dr
- 1620 Peregrine Dr
- 1630 Peregrine Dr
- 1680 Peregrine Dr
- 1565 Peregrine Dr
- 1575 Peregrine Dr
- 1555 Peregrine Dr
- 1590 Peregrine Dr
- 1585 Peregrine Dr
- 434 NW Birch Ave