NOT LISTED FOR SALE

1666 Chapin Ave Merrick, NY 11566

Estimated Value: $610,000 - $657,609

3 Beds
1 Bath
1,075 Sq Ft
$590/Sq Ft Est. Value

Last Sold October 01, 2019

Last sale price $430,000 $400 Per Sq Ft

Est. 47% increase in value since last sale

Current estimated payment $4,270/month

About This Home

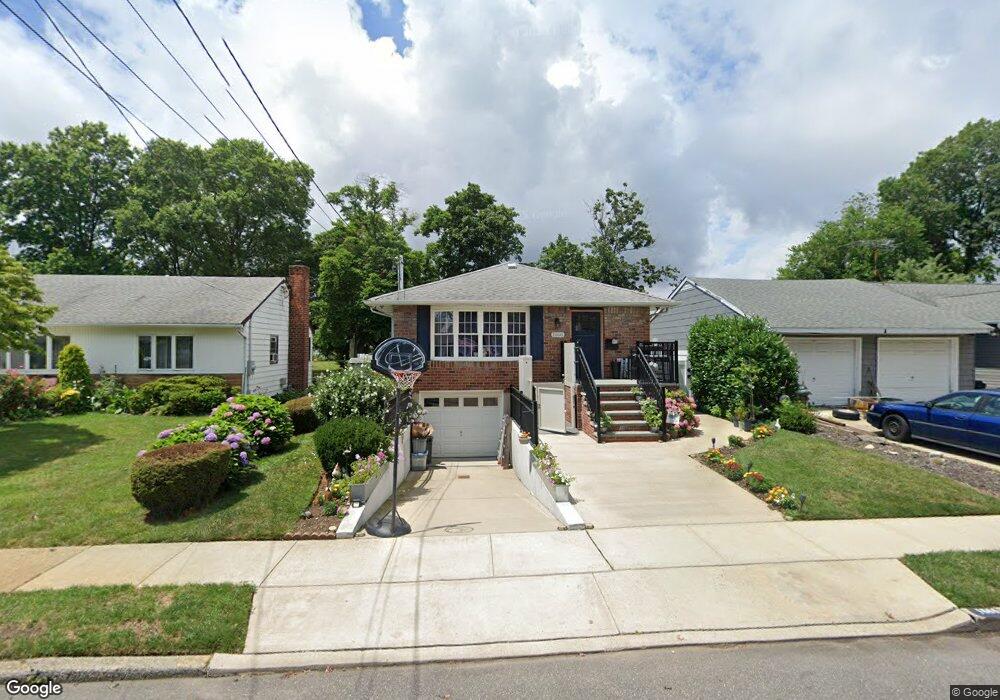
This home is located at 1666 Chapin Ave, Merrick, NY 11566 and is currently estimated at $633,805, approximately $589 per square foot. 1666 Chapin Ave is a home located in Nassau County with nearby schools including Burcham Elementary School, Merrick Avenue Middle School, and Waynoka High School.

Ownership History

Date Name Owned For Owner Type

Purchase Details

Listed on
May 29, 2019
Closed on
Oct 2, 2019
Sold by
Tompson Carolyn
Bought by
Soria Giovanny R and Soria Cynthia L
Seller's Agent
Nancianne Genduso
Coldwell Banker American Homes
Buyer's Agent
Randy Saa
Coldwell Banker American Homes
List Price
$425,000
Sold Price
$430,000
Premium/Discount to List
$5,000
1.18%
Current Estimated Value
$633,805

Home Financials for this Owner

Home Financials are based on the most recent Mortgage that was taken out on this home.
Estimated Appreciation
$203,805
Avg. Annual Appreciation
6.46%
Original Mortgage
$351,200
Interest Rate
3.4%
Mortgage Type
New Conventional
Source: Public Records

Range of Values:

--
Value Increase
--
Percent Increase
--
Adjusted for Inflation
Collateral Analytics

Collateral Analytics Collateral Analytics AVMs (Automated Valuation Model) employ a number of statistical approaches combined with neighborhood-specific comparable selection guarantees the most up-to-date and precise valuations.

Not Available

Collateral Analytics does not have data for the current month. Please view the chart for historical values.

ICE

ICE Mortgage Technology ICE Mortgage Technology’s AVM (Automated Valuation Model) is a state-of-the-art online residential property valuation tool that provides a quick and accurate estimate of the value of almost any home in the U.S.

Not Available

ICE Mortgage Technology does not have data for the current month. Please view the chart for historical values.

First American

First American First American Data & Analytics’ next-generation AVM combines unrivaled data assets with a blended ensemble of valuation models to produce highly accurate, reliable valuations you can trust.

Not Available

First American does not have data for the current month. Please view the chart for historical values.

Quantarium

Quantarium Quantarium’s valuation service, repeatedly proven the industry’s most accurate and comprehensive, is supercharged with a self-learning and auto-tuning AI engine that continually becomes smarter and more accurate as it processes daily inputs from the industry’s leading RE data lake.

Not Available

Quantarium does not have data for the current month. Please view the chart for historical values.

Average Value
Not Available
List Price
Sold Price
Create a Home Valuation Report for This Property
The Home Valuation Report is an in-depth analysis detailing your home's value as well as a comparison with similar homes in the area

Home Values in the Area

Source: Public Records

Average Home Value in this Area


Source: Public Records

Purchase History

Date Buyer Sale Price Title Company
Soria Giovanny R $430,000 None Available
Source: Public Records

Mortgage History

Date Status Borrower Loan Amount
Previous Owner Soria Giovanny R $351,200
Source: Public Records

Property History

Date Event Price List to Sale Price per Sq Ft Prior Sale
10/01/2019 10/01/19 Sold $430,000 +1.2% $400 / Sq Ft View Prior Sale
06/26/2019 06/26/19 Pending -- -- --
05/29/2019 05/29/19 For Sale $425,000 -- $395 / Sq Ft

Tax History Compared to Growth

Source: Public Records

Tax History

Year Tax Paid Tax Assessment Tax Assessment Total Assessment is a certain percentage of the fair market value that is determined by local assessors to be the total taxable value of land and additions on the property. Land Improvement
2025 $11,352 $392 $152 $240
2024 $3,114 $392 $152 $240
2023 $11,586 $392 $152 $240
2022 $11,586 $392 $152 $240
2021 $16,806 $381 $148 $233
2020 $14,820 $773 $547 $226
2019 $2,706 $773 $547 $226
2018 $7,992 $773 $0 $0
2017 $1,194 $773 $547 $226
2016 $3,486 $773 $547 $226
2015 $2,020 $773 $547 $226
2014 $2,020 $773 $547 $226
2013 $1,881 $773 $547 $226
Source: Public Records

Agents Affiliated with this Home

  • Section Image
  • Section Image
See All Agents

Map