
Seller's Agent in 2021
Bill Benninghofen
Keller Williams Capital Ptnrs
(614) 778-4724
5 in this area
59 Total Sales

Estimated Value: $143,000 - $199,003
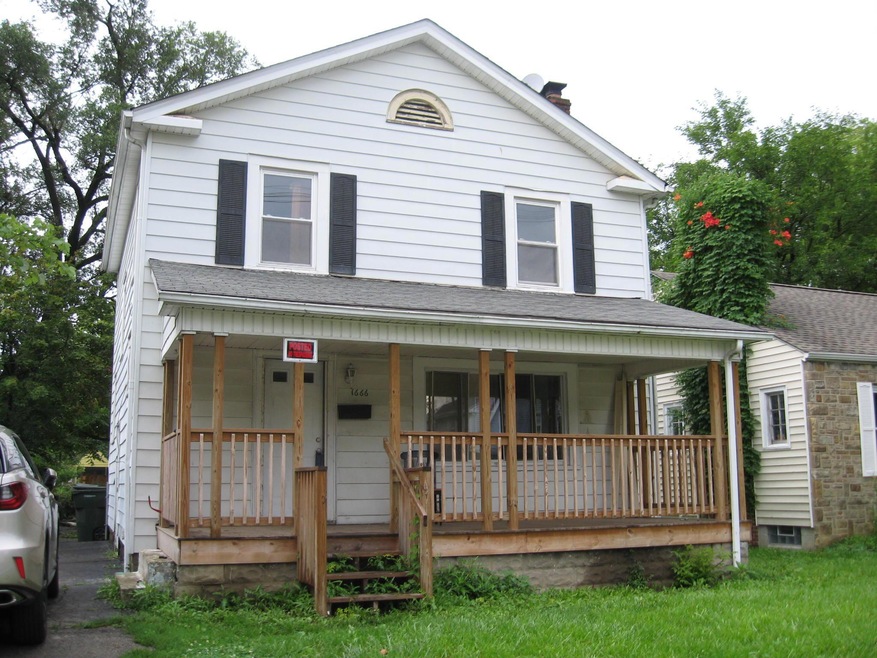
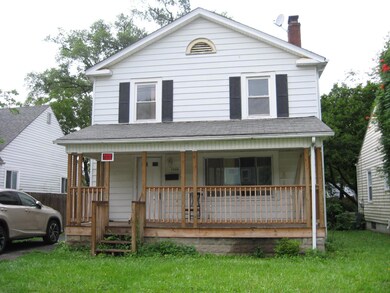
Great opportunity in Kenmore Park! Great for a flip or spruce up and rent it out. Updated furnace, C/A added 12/2019. Updated vinyl windows, new doors. Decorative fireplace. Kitchen eating area could be first floor full or half bath. Great front porch. Offstreet parking with room for a garage.
Last Agent to Sell the Property
Keller Williams Capital Ptnrs License #367160 Listed on: 08/17/2021
| Date | Buyer | Sale Price | Title Company |
|---|---|---|---|
| Ramos Efrain | $105,500 | Northwest Select Ttl Agcy Ll | |
| Borders Amy F | $87,000 | Superior T&E Llc | |
| Davis Johnny L | $52,000 | -- |
| Date | Status | Borrower | Loan Amount |
|---|---|---|---|
| Previous Owner | Borders Amy F | $65,250 | |
| Previous Owner | Davis Johnny L | $49,400 |
| Date | Event | Price | List to Sale | Price per Sq Ft | Prior Sale |
|---|---|---|---|---|---|
| 03/31/2025 03/31/25 | Off Market | $105,500 | -- | -- | |
| 03/31/2025 03/31/25 | Off Market | $87,000 | -- | -- | |
| 09/20/2021 09/20/21 | Sold | $105,500 | -2.3% | $81 / Sq Ft | |
| 09/08/2021 09/08/21 | Pending | -- | -- | -- | |
| 09/03/2021 09/03/21 | Price Changed | $108,000 | -4.4% | $83 / Sq Ft | |
| 08/25/2021 08/25/21 | Price Changed | $113,000 | -1.7% | $87 / Sq Ft | |
| 08/17/2021 08/17/21 | For Sale | $115,000 | +32.2% | $89 / Sq Ft | |
| 12/31/2019 12/31/19 | Sold | $87,000 | -1.0% | $67 / Sq Ft | View Prior Sale |
| 11/15/2019 11/15/19 | Pending | -- | -- | -- | |
| 08/16/2019 08/16/19 | Price Changed | $87,900 | -2.2% | $68 / Sq Ft | |
| 08/10/2019 08/10/19 | For Sale | $89,900 | +3.3% | $69 / Sq Ft | |
| 08/10/2019 08/10/19 | Off Market | $87,000 | -- | -- | |
| 08/09/2019 08/09/19 | For Sale | $89,900 | -- | $69 / Sq Ft |
| Year | Tax Paid | Tax Assessment Tax Assessment Total Assessment is a certain percentage of the fair market value that is determined by local assessors to be the total taxable value of land and additions on the property. | Land | Improvement |
|---|---|---|---|---|
| 2025 | $2,710 | $60,380 | $14,560 | $45,820 |
| 2024 | $2,710 | $60,380 | $14,560 | $45,820 |
| 2023 | $2,675 | $60,375 | $14,560 | $45,815 |
| 2022 | $2,613 | $34,940 | $6,690 | $28,250 |
| 2021 | $2,091 | $34,940 | $6,690 | $28,250 |
| 2020 | $1,844 | $33,710 | $6,690 | $27,020 |
| 2019 | $1,790 | $28,780 | $6,690 | $22,090 |
| 2018 | $1,537 | $28,780 | $6,690 | $22,090 |
| 2017 | $1,789 | $28,780 | $6,690 | $22,090 |
| 2016 | $1,415 | $20,830 | $4,830 | $16,000 |
| 2015 | $1,288 | $20,830 | $4,830 | $16,000 |
| 2014 | $1,292 | $20,830 | $4,830 | $16,000 |
| 2013 | $708 | $23,135 | $5,355 | $17,780 |
Seller's Agent in 2021
Bill Benninghofen
Keller Williams Capital Ptnrs
(614) 778-4724
5 in this area
59 Total Sales
Buyer's Agent in 2021
Sara Marie Brenner
Axen Realty LLC
(740) 816-9339
1 in this area
70 Total Sales
Seller's Agent in 2019
Sean O'Neil
C. R. O'Neil & Co.
(614) 261-6767
3 in this area
43 Total Sales
Source: Columbus and Central Ohio Regional MLS
MLS Number: 221032024
APN: 010-079804
Disclaimer: Certain information contained herein is derived from information provided by parties other than Homes.com. All information provided is deemed reliable, but is not guaranteed to be accurate and should be independently verified.
![]() IDX information is provided exclusively for personal, non-commercial use, and may not be used for any purpose other than to identify prospective properties consumers may be interested in purchasing.
IDX information is provided exclusively for personal, non-commercial use, and may not be used for any purpose other than to identify prospective properties consumers may be interested in purchasing.
Information is deemed reliable but not guaranteed.
Ask me questions while you tour the home.