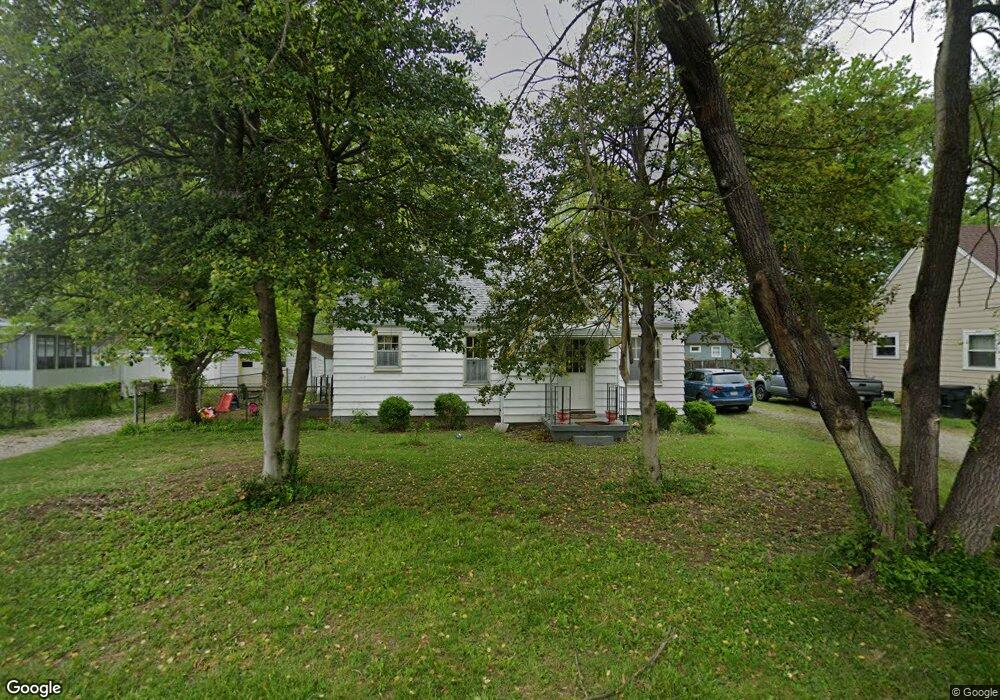
1666 Terry Ln New Albany, IN 47150
Estimated Value: $104,000 - $192,000
2
Beds
1
Bath
856
Sq Ft
$177/Sq Ft
Est. Value
About This Home
This home is located at 1666 Terry Ln, New Albany, IN 47150 and is currently estimated at $151,471, approximately $176 per square foot. 1666 Terry Ln is a home located in Floyd County with nearby schools including Slate Run Elementary School, Hazelwood Middle School, and New Albany Senior High School.
Ownership History
Date
Name
Owned For
Owner Type
Purchase Details
Closed on
Mar 4, 2025
Sold by
Ray Amanda
Bought by
Dandy Dealings Llc
Current Estimated Value
Purchase Details
Closed on
Jan 28, 2025
Sold by
Dandy Dealings Llc
Bought by
Ray Amanda
Purchase Details
Closed on
Jan 3, 2022
Sold by
Dandy Dwellings Llc
Bought by
Dandy Dealings Llc
Home Financials for this Owner
Home Financials are based on the most recent Mortgage that was taken out on this home.
Original Mortgage
$446,000
Interest Rate
2.33%
Mortgage Type
New Conventional
Purchase Details
Closed on
Oct 29, 2021
Sold by
2Nd Wind Llc
Bought by
Dandy Dwellings Llc
Home Financials for this Owner
Home Financials are based on the most recent Mortgage that was taken out on this home.
Original Mortgage
$101,298
Interest Rate
3.01%
Mortgage Type
Stand Alone First
Purchase Details
Closed on
Oct 13, 2021
Sold by
Hosier Eula B and Knight Charles
Bought by
2Nd Wind Llc
Home Financials for this Owner
Home Financials are based on the most recent Mortgage that was taken out on this home.
Original Mortgage
$101,298
Interest Rate
3.01%
Mortgage Type
Stand Alone First
Create a Home Valuation Report for This Property
The Home Valuation Report is an in-depth analysis detailing your home's value as well as a comparison with similar homes in the area
Home Values in the Area
Average Home Value in this Area
Purchase History
| Date | Buyer | Sale Price | Title Company |
|---|---|---|---|
| Dandy Dealings Llc | -- | None Listed On Document | |
| Ray Amanda | -- | None Listed On Document | |
| Dandy Dealings Llc | -- | None Listed On Document | |
| Dandy Dwellings Llc | $160,000 | None Available | |
| 2Nd Wind Llc | $113,000 | Agency Title |
Source: Public Records
Mortgage History
| Date | Status | Borrower | Loan Amount |
|---|---|---|---|
| Previous Owner | Dandy Dealings Llc | $446,000 | |
| Previous Owner | Dandy Dwellings Llc | $101,298 |
Source: Public Records
Tax History Compared to Growth
Tax History
| Year | Tax Paid | Tax Assessment Tax Assessment Total Assessment is a certain percentage of the fair market value that is determined by local assessors to be the total taxable value of land and additions on the property. | Land | Improvement |
|---|---|---|---|---|
| 2024 | $1,873 | $88,200 | $19,500 | $68,700 |
| 2023 | $3,151 | $93,900 | $19,500 | $74,400 |
| 2022 | $1,907 | $89,300 | $19,500 | $69,800 |
| 2021 | $294 | $83,500 | $19,500 | $64,000 |
| 2020 | $289 | $83,500 | $19,500 | $64,000 |
| 2019 | $428 | $90,200 | $19,500 | $70,700 |
| 2018 | $451 | $91,800 | $19,500 | $72,300 |
| 2017 | $261 | $79,900 | $19,500 | $60,400 |
| 2016 | $329 | $85,500 | $19,500 | $66,000 |
| 2014 | $246 | $78,600 | $19,500 | $59,100 |
| 2013 | -- | $78,800 | $19,500 | $59,300 |
Source: Public Records
Map
Nearby Homes
- 1655 Harriett Ct
- 1651 Summit Ave
- 2127 Willard Ave
- 1413 Silver Slate Dr
- 2303 Mclean Ave
- 2216 Morton Ave
- 2218 Fairmont Ave
- 1578 Clifton Ave
- 2548 Broadway St
- 2550 Broadway St
- 916 Korb Ave
- 1324 Roosevelt Ave
- 1435 Bellemeade Dr
- 1672 Garretson Ln
- 13 Bellewood Ct
- 1126 Myrtle Ave
- 8 Robin Ct
- 1352 Miller Ln
- 1749 McDonald Ln
- 1918 Charlestown Rd
- 1664 Terry Ln
- 1670 Terry Ln
- Terry Terry Ln
- 1673 Long Meadow Dr
- 1675 Long Meadow Dr
- 1671 Long Meadow Dr
- 1660 Terry Ln
- 1674 Terry Ln
- 1669 Terry Ln
- 1667 Terry Ln
- 1677 Long Meadow Dr
- 1673 Terry Ln
- 1669 Long Meadow Dr
- 1665 Terry Ln
- 134 Long Meadow Way
- 1658 Terry Ln
- 1676 Terry Ln
- 1679 Long Meadow Dr
- 1661 Terry Ln
- 1667 Long Meadow Dr