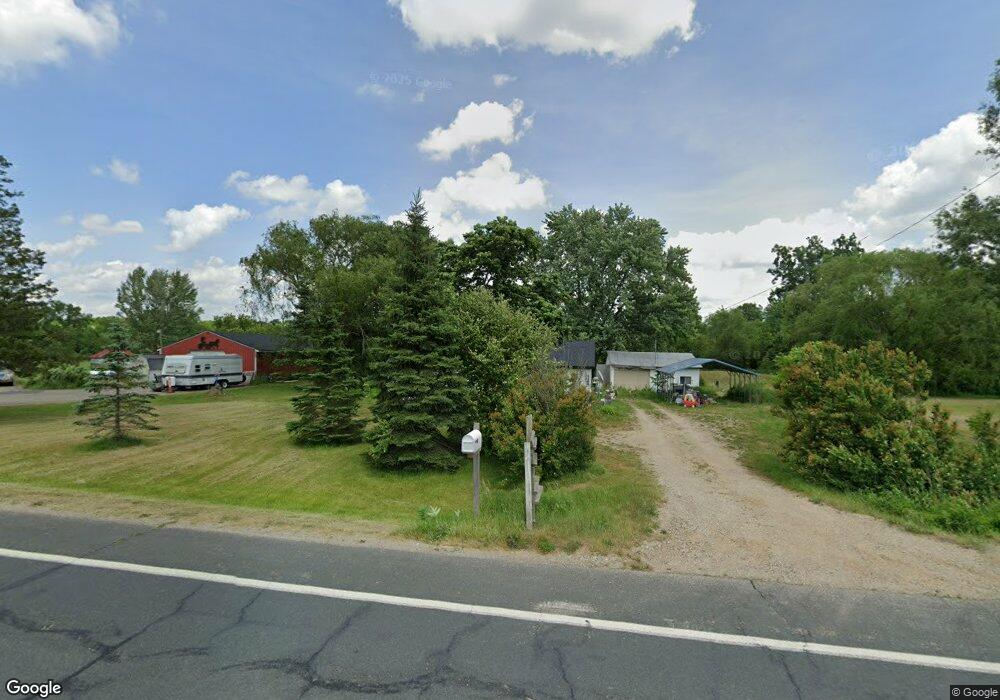
1667 20th St Allegan, MI 49010
Estimated Value: $235,000 - $274,632
2
Beds
1
Bath
960
Sq Ft
$267/Sq Ft
Est. Value
About This Home
This home is located at 1667 20th St, Allegan, MI 49010 and is currently estimated at $256,408, approximately $267 per square foot. 1667 20th St is a home located in Allegan County with nearby schools including Robert D. Brandon Elementary School, Martin High School, and Outlook Academy.
Ownership History
Date
Name
Owned For
Owner Type
Purchase Details
Closed on
Dec 23, 2015
Sold by
Janice B Landback Trust and Landback Janice B
Bought by
Landback Jeffrey C
Current Estimated Value
Purchase Details
Closed on
May 8, 2015
Sold by
Landback Janice B and Landback Gary W
Bought by
Landback Janice B
Purchase Details
Closed on
Apr 18, 2014
Sold by
Landback Gary and Landback Janice
Bought by
Landback Gary and Landback Janice
Purchase Details
Closed on
Mar 26, 2001
Sold by
Kollar Gary M and Kollar Marla R
Bought by
Landback Gary W and Landback Janice B
Home Financials for this Owner
Home Financials are based on the most recent Mortgage that was taken out on this home.
Original Mortgage
$112,500
Outstanding Balance
$41,564
Interest Rate
7.05%
Estimated Equity
$214,844
Create a Home Valuation Report for This Property
The Home Valuation Report is an in-depth analysis detailing your home's value as well as a comparison with similar homes in the area
Home Values in the Area
Average Home Value in this Area
Purchase History
| Date | Buyer | Sale Price | Title Company |
|---|---|---|---|
| Landback Jeffrey C | -- | Attorney | |
| Landback Janice B | -- | None Available | |
| Landback Gary | -- | None Available | |
| Landback Gary | -- | Capital Title | |
| Landback Gary W | $125,000 | Devon Title Company | |
| Landback Gary | $125,000 | -- |
Source: Public Records
Mortgage History
| Date | Status | Borrower | Loan Amount |
|---|---|---|---|
| Open | Landback Gary | $112,500 |
Source: Public Records
Tax History Compared to Growth
Tax History
| Year | Tax Paid | Tax Assessment Tax Assessment Total Assessment is a certain percentage of the fair market value that is determined by local assessors to be the total taxable value of land and additions on the property. | Land | Improvement |
|---|---|---|---|---|
| 2025 | $4,189 | $142,200 | $91,800 | $50,400 |
| 2024 | $2,363 | $141,600 | $91,800 | $49,800 |
| 2023 | $2,363 | $114,500 | $71,400 | $43,100 |
| 2022 | $2,363 | $104,700 | $71,400 | $33,300 |
| 2021 | $2,248 | $102,400 | $71,400 | $31,000 |
| 2020 | $2,248 | $94,100 | $71,400 | $22,700 |
| 2019 | $0 | $94,100 | $71,400 | $22,700 |
| 2018 | $0 | $92,600 | $71,400 | $21,200 |
| 2017 | $0 | $83,200 | $64,000 | $19,200 |
| 2016 | $0 | $83,200 | $64,000 | $19,200 |
| 2015 | -- | $83,200 | $64,000 | $19,200 |
| 2014 | -- | $76,800 | $61,300 | $15,500 |
| 2013 | -- | $68,300 | $53,600 | $14,700 |
Source: Public Records
Map
Nearby Homes
- 2079 W 116th Ave E
- 1880 118th Ave
- 1762 118th Ave
- 2346 116th Ave
- 0 24th St
- 2092 122nd Ave
- 1499 N Big Lake Dr
- V/L
- 1666 14th St
- V/L Fawn Path Parcel A
- 1385 Wetheral Lake Dr
- 2529 Miner Lake Dr
- 2044 110th Ave
- 2707 118th Ave
- 1435 121st Ave
- 908 Double Eagle Dr
- 2208 26th St
- 902 Double Eagle Dr
- 849 18th St
- 0 113th Ave