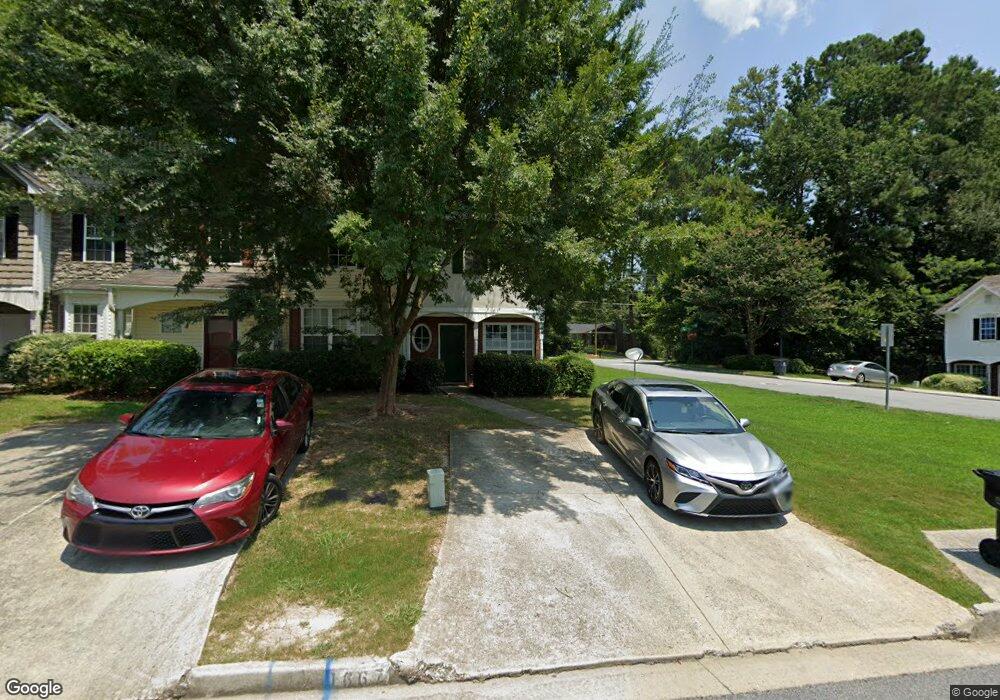
1667 Camden Forrest Way Unit 111 Riverdale, GA 30296
Estimated Value: $138,000 - $169,000
2
Beds
3
Baths
1,024
Sq Ft
$149/Sq Ft
Est. Value
About This Home
This home is located at 1667 Camden Forrest Way Unit 111, Riverdale, GA 30296 and is currently estimated at $152,976, approximately $149 per square foot. 1667 Camden Forrest Way Unit 111 is a home located in Clayton County with nearby schools including Oliver Elementary School, North Clayton Middle School, and North Clayton High School.
Ownership History
Date
Name
Owned For
Owner Type
Purchase Details
Closed on
Jan 15, 2025
Sold by
Khan Parveen
Bought by
3J Properties & Holdings Llc
Current Estimated Value
Purchase Details
Closed on
Oct 22, 2024
Sold by
Khan Muzaffer
Bought by
Khan Parveen
Purchase Details
Closed on
Dec 3, 2014
Sold by
Bhagwandin Dianand Dubay
Bought by
Khan Muzaffer
Purchase Details
Closed on
Sep 15, 2011
Sold by
Secretary Of Housing And U
Bought by
Bhagwandin Dianand Dubay and Bhagwandin Eve Elizabeth
Purchase Details
Closed on
Jan 4, 2011
Sold by
Midfirst Bk
Bought by
Hud-Housing Of Urban Dev
Purchase Details
Closed on
Dec 27, 2001
Sold by
Forrest Homes Inc
Bought by
Napier Lonnie
Home Financials for this Owner
Home Financials are based on the most recent Mortgage that was taken out on this home.
Original Mortgage
$91,492
Interest Rate
7.14%
Mortgage Type
FHA
Create a Home Valuation Report for This Property
The Home Valuation Report is an in-depth analysis detailing your home's value as well as a comparison with similar homes in the area
Home Values in the Area
Average Home Value in this Area
Purchase History
| Date | Buyer | Sale Price | Title Company |
|---|---|---|---|
| 3J Properties & Holdings Llc | $127,500 | -- | |
| Khan Parveen | -- | -- | |
| Khan Muzaffer | $40,000 | -- | |
| Bhagwandin Dianand Dubay | $20,000 | -- | |
| Hud-Housing Of Urban Dev | -- | -- | |
| Midfirst Bk | $84,427 | -- | |
| Napier Lonnie | $92,500 | -- |
Source: Public Records
Mortgage History
| Date | Status | Borrower | Loan Amount |
|---|---|---|---|
| Previous Owner | Napier Lonnie | $91,492 |
Source: Public Records
Tax History Compared to Growth
Tax History
| Year | Tax Paid | Tax Assessment Tax Assessment Total Assessment is a certain percentage of the fair market value that is determined by local assessors to be the total taxable value of land and additions on the property. | Land | Improvement |
|---|---|---|---|---|
| 2024 | $2,491 | $62,880 | $5,600 | $57,280 |
| 2023 | $2,208 | $61,160 | $5,600 | $55,560 |
| 2022 | $1,842 | $45,960 | $5,600 | $40,360 |
| 2021 | $1,539 | $38,000 | $5,600 | $32,400 |
| 2020 | $1,315 | $31,932 | $5,600 | $26,332 |
| 2019 | $1,066 | $25,325 | $4,800 | $20,525 |
| 2018 | $671 | $15,600 | $4,800 | $10,800 |
| 2017 | $673 | $15,600 | $4,800 | $10,800 |
| 2016 | $730 | $20,015 | $4,800 | $15,215 |
| 2015 | $678 | $0 | $0 | $0 |
| 2014 | $648 | $18,030 | $5,600 | $12,430 |
Source: Public Records
Map
Nearby Homes
- 6080 Camden Forrest Cove
- 1695 Camden Forrest Trail
- 6076 Camden Forrest Dr
- 6105 E Fayetteville Dr
- 6073 Camden Forrest Dr
- 6099 Camden Forrest Dr
- 5967 Yellowood Ct
- 6105 Camden Forrest Ct
- 6181 E Fayetteville Dr
- 1711 Austin Dr
- 0 Cater Ln Unit 10461792
- 0 Cater Ln Unit 7526768
- 5937 Yellowood Ct
- 1791 Flat Shoals Rd
- 6207 Willowbrook Dr
- 1593 Willow Wood Trace
- 6253 E Fayetteville Dr
- 1618 Blossom Dr
- 1489 Cedar Creek Ln
- 1669 Camden Forrest Way
- 1671 Camden Forrest Way
- 1673 Camden Forrest Way
- 0 Camden Forrest Way Unit 3191671
- 0 Camden Forrest Way Unit 8615687
- 0 Camden Forrest Way Unit 7141067
- 0 Camden Forrest Way Unit 8496281
- 1675 Camden Forrest Way
- 6076 Camden Forrest Cove
- 6076 Camden Forrest Cove Unit 6076
- 1677 Camden Forrest Way Unit 111
- 1677 Camden Forrest Way
- 6087 Camden Forrest Cove
- 6078 Camden Forrest Cove
- 6080 Camden Forrest Cove Unit 6080
- 6080 Camden Forrest Cove Unit N/A
- 1679 Camden Forrest Way
- 6084 Camden Forrest Cove
- 6089 Camden Forrest Cove
- 1681 Camden Forrest Way