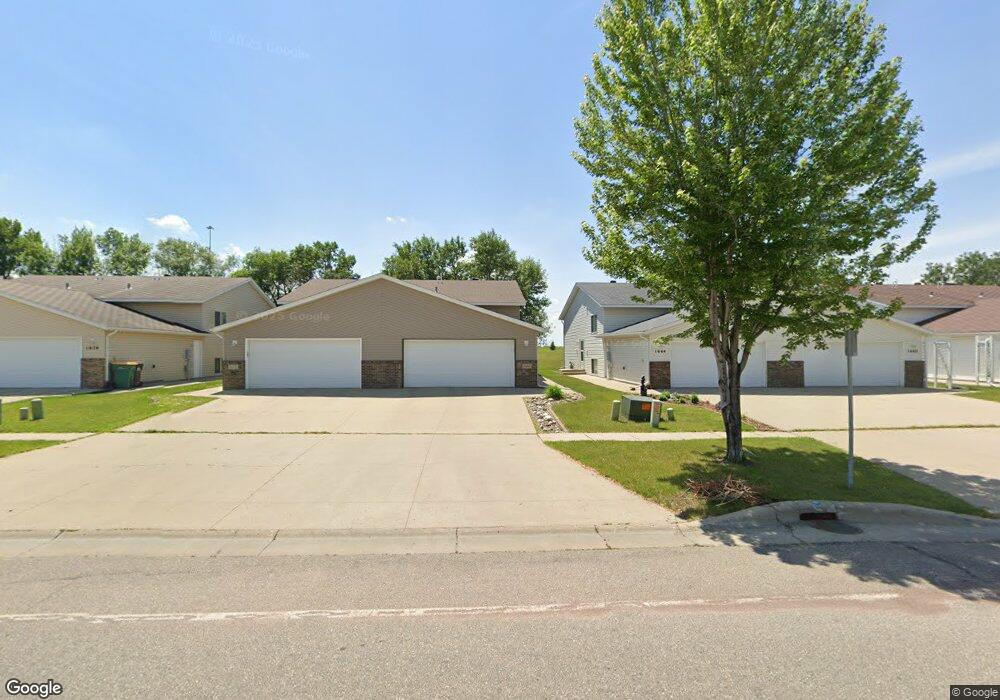
1668 10th St W West Fargo, ND 58078
Elmwood Court NeighborhoodEstimated Value: $263,000 - $266,579
3
Beds
2
Baths
1,672
Sq Ft
$158/Sq Ft
Est. Value
About This Home
This home is located at 1668 10th St W, West Fargo, ND 58078 and is currently estimated at $264,790, approximately $158 per square foot. 1668 10th St W is a home located in Cass County with nearby schools including Westside Elementary School, Cheney Middle School, and West Fargo High School.
Ownership History
Date
Name
Owned For
Owner Type
Purchase Details
Closed on
Dec 17, 2018
Sold by
Berry Sharon R and Scott Berry G
Bought by
Bakken Richard G
Current Estimated Value
Home Financials for this Owner
Home Financials are based on the most recent Mortgage that was taken out on this home.
Original Mortgage
$163,590
Outstanding Balance
$144,126
Interest Rate
4.8%
Mortgage Type
New Conventional
Estimated Equity
$120,664
Purchase Details
Closed on
Mar 9, 2017
Sold by
Berry Sharon R and Nitzkorski Sharon R
Bought by
Berry Sharon R and Berry Scott G
Purchase Details
Closed on
Jun 14, 2011
Sold by
Heidbreder Rachel R and Heidbreder Daniel
Bought by
Nitzkorski Sharon R
Home Financials for this Owner
Home Financials are based on the most recent Mortgage that was taken out on this home.
Original Mortgage
$125,242
Interest Rate
4.7%
Mortgage Type
FHA
Purchase Details
Closed on
Jan 31, 2005
Sold by
L T D Corporation
Bought by
Wallock Rachel R
Home Financials for this Owner
Home Financials are based on the most recent Mortgage that was taken out on this home.
Original Mortgage
$102,900
Interest Rate
5.79%
Mortgage Type
FHA
Create a Home Valuation Report for This Property
The Home Valuation Report is an in-depth analysis detailing your home's value as well as a comparison with similar homes in the area
Home Values in the Area
Average Home Value in this Area
Purchase History
| Date | Buyer | Sale Price | Title Company |
|---|---|---|---|
| Bakken Richard G | $172,200 | None Available | |
| Berry Sharon R | -- | Title Co | |
| Nitzkorski Sharon R | $128,500 | None Available | |
| Wallock Rachel R | -- | -- |
Source: Public Records
Mortgage History
| Date | Status | Borrower | Loan Amount |
|---|---|---|---|
| Open | Bakken Richard G | $163,590 | |
| Previous Owner | Nitzkorski Sharon R | $125,242 | |
| Previous Owner | Wallock Rachel R | $102,900 |
Source: Public Records
Tax History Compared to Growth
Tax History
| Year | Tax Paid | Tax Assessment Tax Assessment Total Assessment is a certain percentage of the fair market value that is determined by local assessors to be the total taxable value of land and additions on the property. | Land | Improvement |
|---|---|---|---|---|
| 2024 | $1,544 | $115,700 | $17,250 | $98,450 |
| 2023 | $3,260 | $112,550 | $17,250 | $95,300 |
| 2022 | $3,115 | $102,750 | $17,250 | $85,500 |
| 2021 | $2,943 | $93,400 | $13,800 | $79,600 |
| 2020 | $2,719 | $89,300 | $13,800 | $75,500 |
| 2019 | $2,512 | $86,700 | $13,800 | $72,900 |
| 2018 | $3,089 | $86,700 | $13,800 | $72,900 |
| 2017 | $3,051 | $83,850 | $13,800 | $70,050 |
| 2016 | $2,802 | $81,100 | $13,800 | $67,300 |
| 2015 | $2,689 | $68,950 | $4,500 | $64,450 |
| 2014 | $2,682 | $64,450 | $4,500 | $59,950 |
| 2013 | $2,594 | $62,700 | $4,500 | $58,200 |
Source: Public Records
Map
Nearby Homes