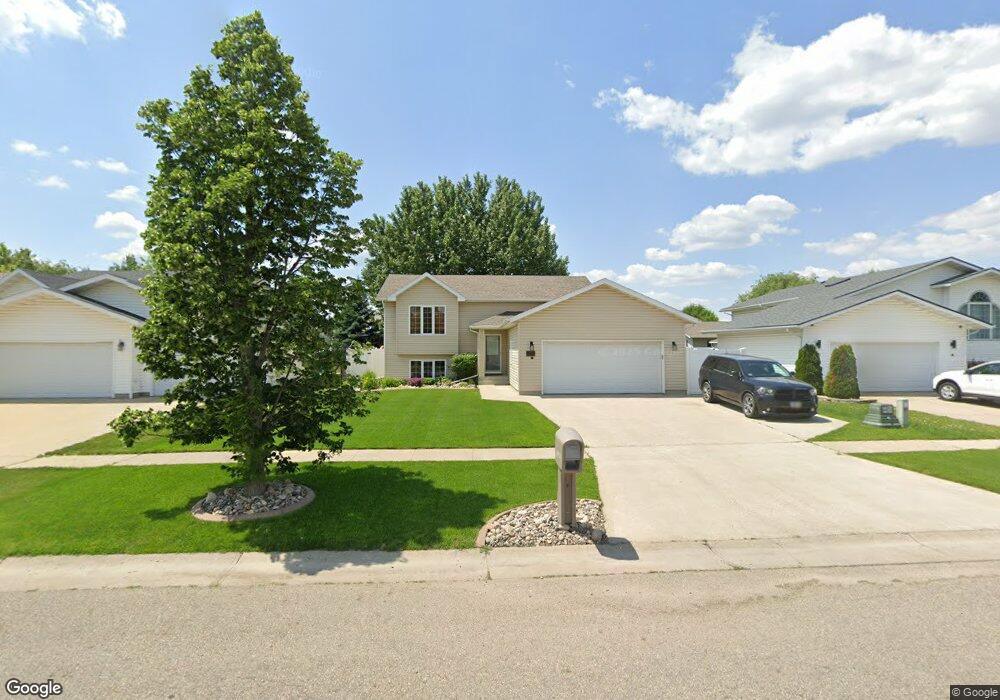
1668 8th St E West Fargo, ND 58078
Charleswood NeighborhoodEstimated Value: $342,000 - $363,330
4
Beds
2
Baths
1,892
Sq Ft
$186/Sq Ft
Est. Value
About This Home
This home is located at 1668 8th St E, West Fargo, ND 58078 and is currently estimated at $352,665, approximately $186 per square foot. 1668 8th St E is a home located in Cass County with nearby schools including South Elementary School, Cheney Middle School, and West Fargo High School.
Ownership History
Date
Name
Owned For
Owner Type
Purchase Details
Closed on
Aug 3, 2020
Sold by
Gunderson Zachary S and Gunderson Lindsay A
Bought by
Ackerland Joshua R and Ackerland Dawn
Current Estimated Value
Home Financials for this Owner
Home Financials are based on the most recent Mortgage that was taken out on this home.
Original Mortgage
$249,290
Outstanding Balance
$221,546
Interest Rate
3.1%
Mortgage Type
New Conventional
Estimated Equity
$131,119
Purchase Details
Closed on
Aug 31, 2015
Sold by
Leiseth Trevor G and Leiseth Kristi L
Bought by
Gunderson Zachary S and Gunderson Lindsey A
Home Financials for this Owner
Home Financials are based on the most recent Mortgage that was taken out on this home.
Original Mortgage
$228,288
Interest Rate
3.87%
Mortgage Type
FHA
Create a Home Valuation Report for This Property
The Home Valuation Report is an in-depth analysis detailing your home's value as well as a comparison with similar homes in the area
Home Values in the Area
Average Home Value in this Area
Purchase History
| Date | Buyer | Sale Price | Title Company |
|---|---|---|---|
| Ackerland Joshua R | $257,000 | Fm Title | |
| Gunderson Zachary S | $232,500 | None Available |
Source: Public Records
Mortgage History
| Date | Status | Borrower | Loan Amount |
|---|---|---|---|
| Open | Ackerland Joshua R | $249,290 | |
| Previous Owner | Gunderson Zachary S | $228,288 |
Source: Public Records
Tax History Compared to Growth
Tax History
| Year | Tax Paid | Tax Assessment Tax Assessment Total Assessment is a certain percentage of the fair market value that is determined by local assessors to be the total taxable value of land and additions on the property. | Land | Improvement |
|---|---|---|---|---|
| 2024 | $3,338 | $132,650 | $25,500 | $107,150 |
| 2023 | $3,700 | $126,950 | $25,500 | $101,450 |
| 2022 | $3,722 | $123,300 | $25,500 | $97,800 |
| 2021 | $3,465 | $110,200 | $21,000 | $89,200 |
| 2020 | $3,197 | $103,050 | $21,000 | $82,050 |
| 2019 | $2,974 | $101,300 | $21,000 | $80,300 |
| 2018 | $2,840 | $99,650 | $21,000 | $78,650 |
| 2017 | $2,789 | $99,650 | $21,000 | $78,650 |
| 2016 | $2,522 | $98,200 | $21,000 | $77,200 |
| 2015 | $3,615 | $99,100 | $15,300 | $83,800 |
| 2014 | $3,477 | $92,600 | $15,300 | $77,300 |
| 2013 | $3,513 | $88,900 | $15,300 | $73,600 |
Source: Public Records
Map
Nearby Homes
- 1662 8th St E
- 1674 8th St E
- 1680 8th St E
- 1656 8th St E
- 753 Wyndemere Dr
- 757 Wyndemere Dr
- 1686 8th St E
- 749 Wyndemere Dr
- 761 Wyndemere Dr
- 1661 8th St E
- 1673 8th St E
- 816 Lakeridge Dr
- 1679 8th St E
- 1655 8th St E
- 1685 8th St E
- 790 Lakeridge Dr
- 784 Lakeridge Dr
- 790 Lakeridge Dr
- 745 Wyndemere Dr
- 823 Lakeridge Place