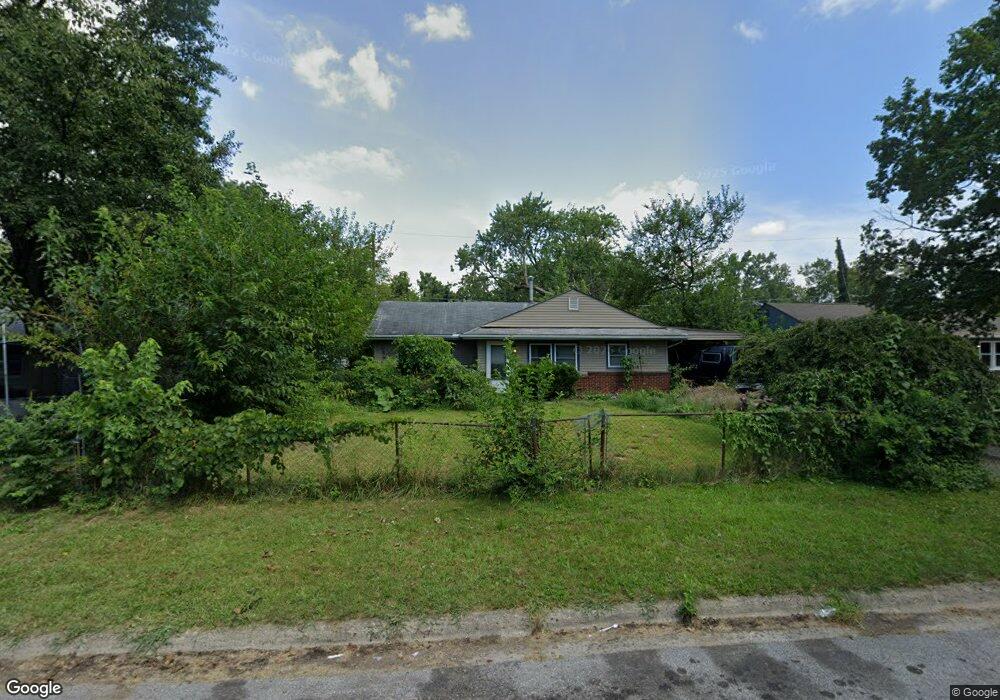
1668 Marsdale Ave Columbus, OH 43223
Estimated Value: $173,314 - $191,000
3
Beds
2
Baths
1,234
Sq Ft
$147/Sq Ft
Est. Value
About This Home
This home is located at 1668 Marsdale Ave, Columbus, OH 43223 and is currently estimated at $181,329, approximately $146 per square foot. 1668 Marsdale Ave is a home located in Franklin County with nearby schools including Finland Elementary School, Franklin Woods Intermediate School, and Finland Middle School.
Ownership History
Date
Name
Owned For
Owner Type
Purchase Details
Closed on
Jun 21, 2007
Sold by
Horsley Krista M
Bought by
Bond Debra S
Current Estimated Value
Home Financials for this Owner
Home Financials are based on the most recent Mortgage that was taken out on this home.
Original Mortgage
$53,226
Outstanding Balance
$32,885
Interest Rate
6.37%
Mortgage Type
FHA
Estimated Equity
$148,444
Purchase Details
Closed on
Jun 11, 2004
Sold by
Columbus Equities Corp
Bought by
Horsley Krista M
Home Financials for this Owner
Home Financials are based on the most recent Mortgage that was taken out on this home.
Original Mortgage
$36,346
Interest Rate
6.17%
Mortgage Type
Purchase Money Mortgage
Purchase Details
Closed on
Aug 12, 1987
Bought by
Columbus Equities Corp
Purchase Details
Closed on
Jul 1, 1985
Purchase Details
Closed on
Apr 1, 1985
Create a Home Valuation Report for This Property
The Home Valuation Report is an in-depth analysis detailing your home's value as well as a comparison with similar homes in the area
Home Values in the Area
Average Home Value in this Area
Purchase History
| Date | Buyer | Sale Price | Title Company |
|---|---|---|---|
| Bond Debra S | $75,000 | Prefered | |
| Horsley Krista M | $37,500 | Independent | |
| Columbus Equities Corp | $25,100 | -- | |
| -- | $29,000 | -- | |
| -- | -- | -- |
Source: Public Records
Mortgage History
| Date | Status | Borrower | Loan Amount |
|---|---|---|---|
| Open | Bond Debra S | $53,226 | |
| Previous Owner | Horsley Krista M | $36,346 |
Source: Public Records
Tax History Compared to Growth
Tax History
| Year | Tax Paid | Tax Assessment Tax Assessment Total Assessment is a certain percentage of the fair market value that is determined by local assessors to be the total taxable value of land and additions on the property. | Land | Improvement |
|---|---|---|---|---|
| 2024 | $2,670 | $52,360 | $7,630 | $44,730 |
| 2023 | $2,656 | $52,360 | $7,630 | $44,730 |
| 2022 | $1,861 | $24,570 | $8,540 | $16,030 |
| 2021 | $1,813 | $24,570 | $8,540 | $16,030 |
| 2020 | $1,961 | $24,570 | $8,540 | $16,030 |
| 2019 | $1,560 | $19,990 | $7,110 | $12,880 |
| 2018 | $1,575 | $19,990 | $7,110 | $12,880 |
| 2017 | $1,515 | $19,990 | $7,110 | $12,880 |
| 2016 | $1,486 | $18,030 | $3,190 | $14,840 |
| 2015 | $1,380 | $18,030 | $3,190 | $14,840 |
| 2014 | $1,380 | $18,030 | $3,190 | $14,840 |
| 2013 | $798 | $21,210 | $3,745 | $17,465 |
Source: Public Records
Map
Nearby Homes
- 1417 Fahy Dr
- 1607 Red Leaf Ln
- 1390 Gray Meadow Dr
- 1543 Red Leaf Ln
- 1723 Farberdale Dr
- 1948 Big Run Bluffs Blvd
- 1949 Big Run Bluffs Blvd
- 2210 October Ridge Dr
- 1532 Westmeadow Dr
- 4745 Big Run Rd E
- 0 S Central Ave
- 1994 Little Ave
- 1663 Hopkins Ave
- 2436 Onyx Ct
- 1969 Forest Lake Ct
- 1540 Little Ave
- 1757 Linnet Ave
- 2180 Eakin Rd
- 2272 Anndel Ct
- 2242 Topaz Dr
- 1676 Marsdale Ave
- 1660 Marsdale Ave
- 1661 Eastfield Dr N
- 1667 Eastfield Dr N
- 1655 Eastfield Dr N
- 1684 Marsdale Ave
- 1652 Marsdale Ave
- 1665 Marsdale Ave
- 1671 Marsdale Ave
- 1675 Eastfield Dr N
- 1647 Eastfield Dr N
- 1655 Marsdale Ave
- 1677 Marsdale Ave
- 1690 Marsdale Ave
- 1646 Marsdale Ave
- 1681 Eastfield Dr N
- 1649 Marsdale Ave
- 1641 Eastfield Dr N
- 1687 Marsdale Ave
- 1696 Marsdale Ave