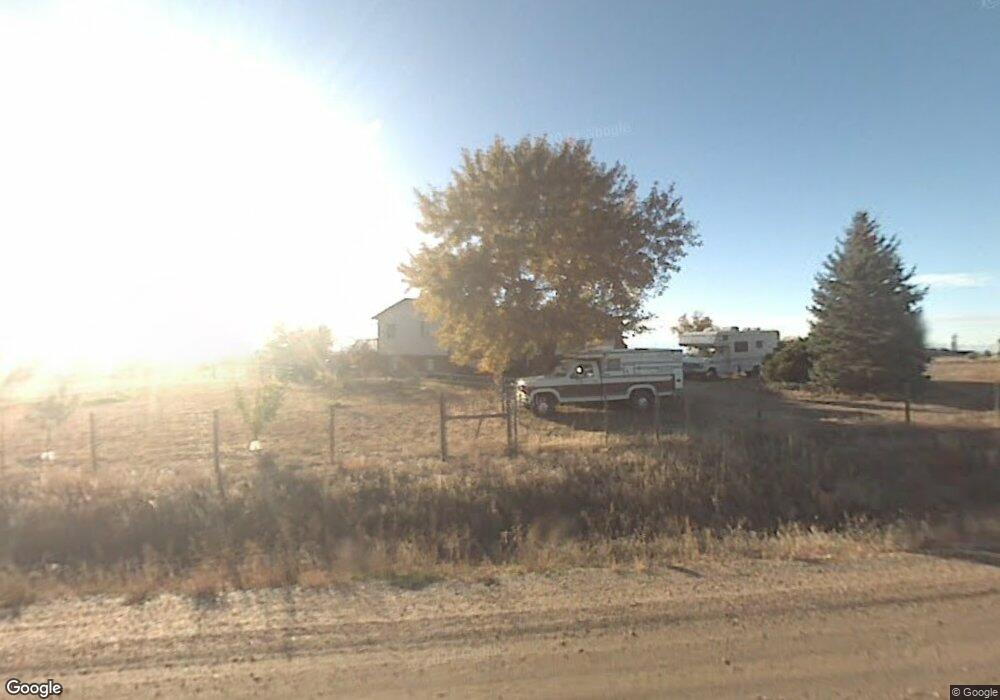
16683 Tower Rd Brighton, CO 80601
Estimated Value: $746,000 - $807,000
4
Beds
3
Baths
2,534
Sq Ft
$305/Sq Ft
Est. Value
About This Home
This home is located at 16683 Tower Rd, Brighton, CO 80601 and is currently estimated at $773,161, approximately $305 per square foot. 16683 Tower Rd is a home located in Adams County with nearby schools including Overland Trail Middle School, Brighton High School, and Bromley East Charter School.
Ownership History
Date
Name
Owned For
Owner Type
Purchase Details
Closed on
Mar 16, 2005
Sold by
Franco Javier and Zapien Sandra
Bought by
Arnall Michael F and Taylor Jolene
Current Estimated Value
Home Financials for this Owner
Home Financials are based on the most recent Mortgage that was taken out on this home.
Original Mortgage
$225,000
Outstanding Balance
$114,145
Interest Rate
5.62%
Mortgage Type
Unknown
Estimated Equity
$659,016
Purchase Details
Closed on
Sep 6, 2002
Sold by
Olguin Fred R and Olguin Deborah Ann
Bought by
Franco Javier and Zapien Sandra
Home Financials for this Owner
Home Financials are based on the most recent Mortgage that was taken out on this home.
Original Mortgage
$248,000
Interest Rate
7.15%
Purchase Details
Closed on
Jun 17, 1994
Sold by
Petersen Russell E
Bought by
Olguin Fred R and Olguin Deborah Ann
Home Financials for this Owner
Home Financials are based on the most recent Mortgage that was taken out on this home.
Original Mortgage
$150,850
Interest Rate
8.75%
Purchase Details
Closed on
Aug 26, 1991
Create a Home Valuation Report for This Property
The Home Valuation Report is an in-depth analysis detailing your home's value as well as a comparison with similar homes in the area
Home Values in the Area
Average Home Value in this Area
Purchase History
| Date | Buyer | Sale Price | Title Company |
|---|---|---|---|
| Arnall Michael F | $325,000 | Security Title | |
| Franco Javier | $310,000 | -- | |
| Olguin Fred R | $159,000 | -- | |
| -- | -- | -- |
Source: Public Records
Mortgage History
| Date | Status | Borrower | Loan Amount |
|---|---|---|---|
| Open | Arnall Michael F | $225,000 | |
| Previous Owner | Franco Javier | $248,000 | |
| Previous Owner | Olguin Fred R | $150,850 |
Source: Public Records
Tax History Compared to Growth
Tax History
| Year | Tax Paid | Tax Assessment Tax Assessment Total Assessment is a certain percentage of the fair market value that is determined by local assessors to be the total taxable value of land and additions on the property. | Land | Improvement |
|---|---|---|---|---|
| 2024 | $5,125 | $46,760 | $9,380 | $37,380 |
| 2023 | $5,094 | $52,500 | $9,000 | $43,500 |
| 2022 | $3,136 | $30,080 | $9,240 | $20,840 |
| 2021 | $2,935 | $30,080 | $9,240 | $20,840 |
| 2020 | $3,298 | $35,360 | $9,220 | $26,140 |
| 2019 | $3,306 | $35,360 | $9,220 | $26,140 |
| 2018 | $2,766 | $29,500 | $8,640 | $20,860 |
| 2017 | $2,770 | $29,500 | $8,640 | $20,860 |
| 2016 | $2,306 | $24,410 | $6,290 | $18,120 |
| 2015 | $2,289 | $24,410 | $6,290 | $18,120 |
| 2014 | $1,924 | $20,790 | $4,540 | $16,250 |
Source: Public Records
Map
Nearby Homes
- 608 Hayloft Way
- 445 Tumbleweed Dr
- 4250 Combine Place
- 16791 Telluride St
- 215 Blue Bonnet Dr Unit 9C
- 3978 Balderas St
- 3938 Balderas St
- 156 Chapel Hill Cir
- 4545 Oxbow Dr
- 147 Chapel Hill Cir
- 256 Homestead Way
- 207 Harrow Ct
- 4532 Dewey Ln
- 4479 Boone Cir
- 118 Foxglove Dr Unit 23D
- 4649 Spinning Wheel Dr
- 4436 Windmill Dr
- 4455 Boone Cir
- 4645 Longs Peak St
- 4439 Boone Cir
- 18363 Zeno Ct
- 551 Farmhouse Way
- 581 Farmhouse Way
- 531 Farmhouse Way
- 18452 Zeno Ct
- 591 Farmhouse Way
- 521 Farmhouse Way
- 18362 Zeno Ct
- 491 Farmhouse Way
- 18283 Zeno Ct
- 4041 Harvest Ln
- 16563 Tower Rd
- 562 Farmhouse Way
- 542 Farmhouse Way
- 4042 Harvest Ln
- 522 Farmhouse Way
- 481 Farmhouse Way
- 16650 Horizon Dr
- 512 Farmhouse Way
- 4051 Harvest Ln