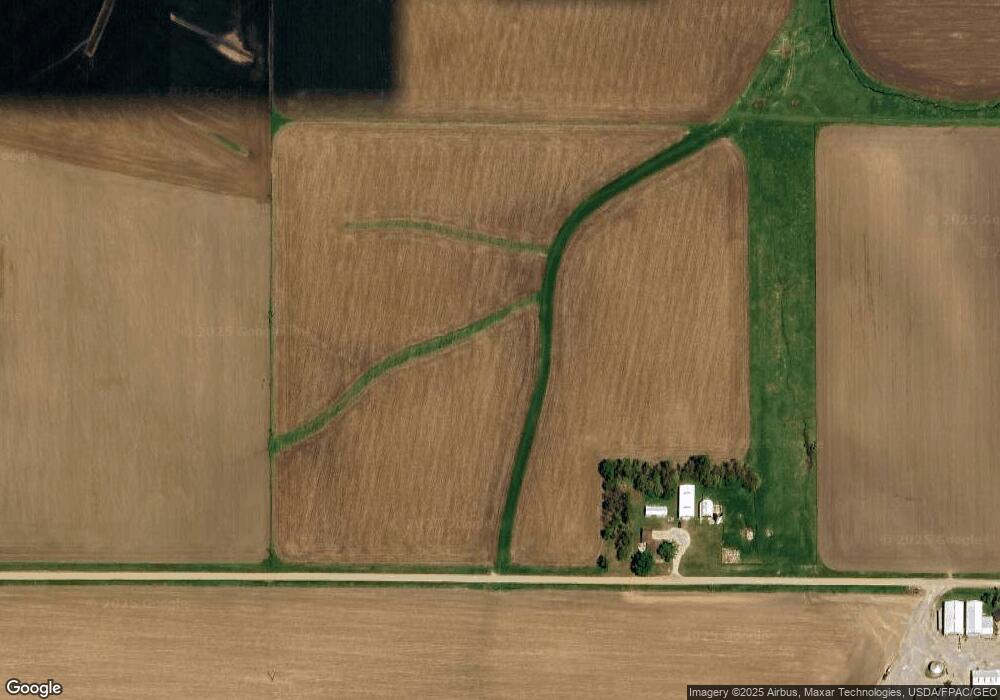
1669 260th St Odebolt, IA 51458
Estimated Value: $247,000 - $739,702
Studio
3
Baths
2,152
Sq Ft
$229/Sq Ft
Est. Value
About This Home
This home is located at 1669 260th St, Odebolt, IA 51458 and is currently estimated at $493,351, approximately $229 per square foot. 1669 260th St is a home located in Sac County with nearby schools including Odebolt Arthur Battle Creek Ida Grove Elementary - Odebolt, Odebolt Arthur Battle Creek Ida Grove Middle School, and Odebolt Arthur Battle Creek Ida Grove High School.
Ownership History
Date
Name
Owned For
Owner Type
Purchase Details
Closed on
May 23, 2006
Sold by
Mcdonough Kent and Mcdonough Jodi
Bought by
Mcdonough Jeffrey
Current Estimated Value
Purchase Details
Closed on
May 22, 2006
Sold by
Mcdonough Todd and Mcdonough Beth
Bought by
Mcdonough Jeffrey
Purchase Details
Closed on
May 19, 2006
Sold by
Mcdonough Charles
Bought by
Mcdonough Jeffrey
Create a Home Valuation Report for This Property
The Home Valuation Report is an in-depth analysis detailing your home's value as well as a comparison with similar homes in the area
Purchase History
| Date | Buyer | Sale Price | Title Company |
|---|---|---|---|
| Mcdonough Jeffrey | -- | None Available | |
| Mcdonough Jeffrey | -- | None Available | |
| Mcdonough Jeffrey | -- | None Available | |
| Mcdonough Jeffrey | -- | None Available | |
| Mcdonough Jeffrey | -- | None Available |
Source: Public Records
Tax History
| Year | Tax Paid | Tax Assessment Tax Assessment Total Assessment is a certain percentage of the fair market value that is determined by local assessors to be the total taxable value of land and additions on the property. | Land | Improvement |
|---|---|---|---|---|
| 2025 | $6,572 | $636,860 | $106,890 | $529,970 |
| 2024 | $6,572 | $540,980 | $83,960 | $457,020 |
| 2023 | $5,928 | $540,980 | $83,960 | $457,020 |
| 2022 | $5,816 | $398,180 | $66,350 | $331,830 |
| 2021 | $5,816 | $398,180 | $66,350 | $331,830 |
| 2020 | $4,768 | $342,480 | $59,610 | $282,870 |
| 2019 | $4,378 | $342,480 | $59,610 | $282,870 |
| 2018 | $4,124 | $357,280 | $0 | $0 |
| 2017 | $4,124 | $347,630 | $0 | $0 |
| 2016 | $4,104 | $347,630 | $0 | $0 |
| 2015 | $4,104 | $338,990 | $0 | $0 |
| 2014 | $3,880 | $338,990 | $0 | $0 |
Source: Public Records
Map
Nearby Homes
Your Personal Tour Guide
Ask me questions while you tour the home.