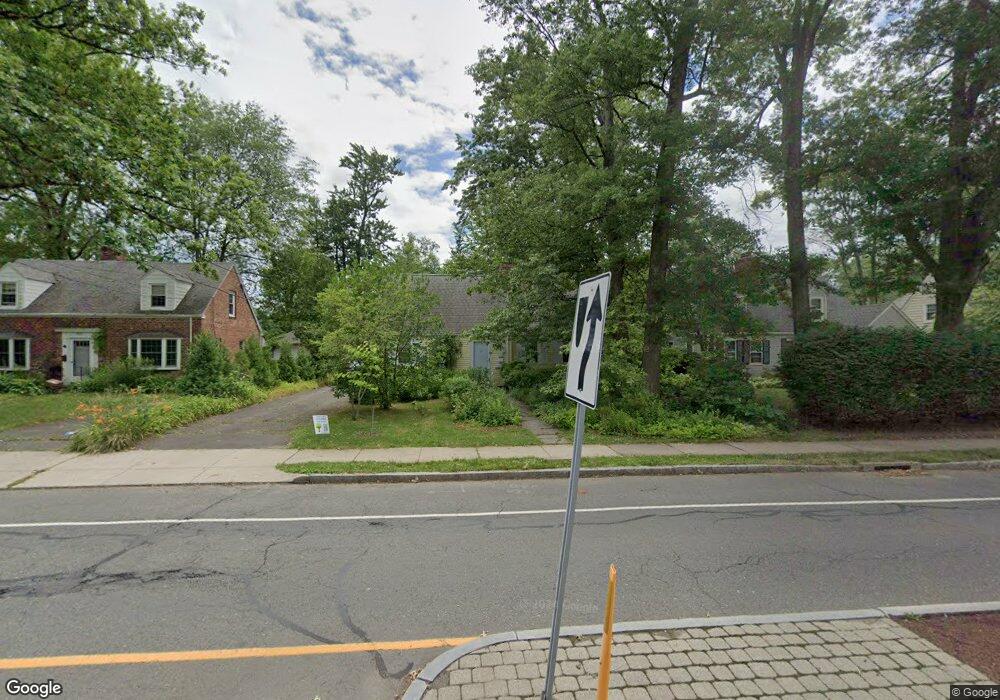
1669 Asylum Ave West Hartford, CT 06117
Estimated Value: $376,000 - $438,000
3
Beds
1
Bath
1,266
Sq Ft
$325/Sq Ft
Est. Value
About This Home
This home is located at 1669 Asylum Ave, West Hartford, CT 06117 and is currently estimated at $411,041, approximately $324 per square foot. 1669 Asylum Ave is a home located in Hartford County with nearby schools including Morley School, King Philip Middle School, and Hall High School.
Ownership History
Date
Name
Owned For
Owner Type
Purchase Details
Closed on
Jul 29, 2024
Sold by
Miller Ruth K
Bought by
Miller Ruth K and Miller James E
Current Estimated Value
Purchase Details
Closed on
Oct 30, 2002
Sold by
Mullarkey Margaret A
Bought by
Klue Ruth Anne
Home Financials for this Owner
Home Financials are based on the most recent Mortgage that was taken out on this home.
Original Mortgage
$60,000
Interest Rate
6.09%
Create a Home Valuation Report for This Property
The Home Valuation Report is an in-depth analysis detailing your home's value as well as a comparison with similar homes in the area
Home Values in the Area
Average Home Value in this Area
Purchase History
| Date | Buyer | Sale Price | Title Company |
|---|---|---|---|
| Miller Ruth K | -- | None Available | |
| Miller Ruth K | -- | None Available | |
| Klue Ruth Anne | $165,000 | -- | |
| Klue Ruth Anne | $165,000 | -- |
Source: Public Records
Mortgage History
| Date | Status | Borrower | Loan Amount |
|---|---|---|---|
| Previous Owner | Klue Ruth Anne | $60,000 | |
| Previous Owner | Klue Ruth Anne | $35,000 |
Source: Public Records
Tax History Compared to Growth
Tax History
| Year | Tax Paid | Tax Assessment Tax Assessment Total Assessment is a certain percentage of the fair market value that is determined by local assessors to be the total taxable value of land and additions on the property. | Land | Improvement |
|---|---|---|---|---|
| 2025 | $7,792 | $174,000 | $83,000 | $91,000 |
| 2024 | $7,369 | $174,000 | $83,000 | $91,000 |
| 2023 | $7,120 | $174,000 | $83,000 | $91,000 |
| 2022 | $7,078 | $174,000 | $83,000 | $91,000 |
| 2021 | $6,500 | $153,230 | $86,500 | $66,730 |
| 2020 | $6,405 | $153,230 | $80,900 | $72,330 |
| 2019 | $6,405 | $153,230 | $80,920 | $72,310 |
| 2018 | $6,282 | $153,230 | $80,920 | $72,310 |
| 2017 | $6,289 | $153,230 | $80,920 | $72,310 |
| 2016 | $6,262 | $158,480 | $79,800 | $78,680 |
| 2015 | $6,071 | $158,480 | $79,800 | $78,680 |
| 2014 | $5,922 | $158,480 | $79,800 | $78,680 |
Source: Public Records
Map
Nearby Homes
- 1272 Trout Brook Dr
- 11 Lawler Rd
- 3 Pilgrim Rd
- 1993 Albany Ave
- 1196 Trout Brook Dr
- 320 N Steele Rd
- 237 Fern St Unit 314
- 5 Adams Ln
- 105 Ardmore Rd
- 48 Walkley Rd
- 59 Milton St
- 1110 Trout Brook Dr
- 5 Northmoor Rd
- 16 Lilley Rd
- 132 N Main St
- 276 Oxford St Unit 278
- 260 Oxford St Unit 262
- 54 Robin Rd Unit B2
- 275 Kenyon St
- 175 Scarborough St