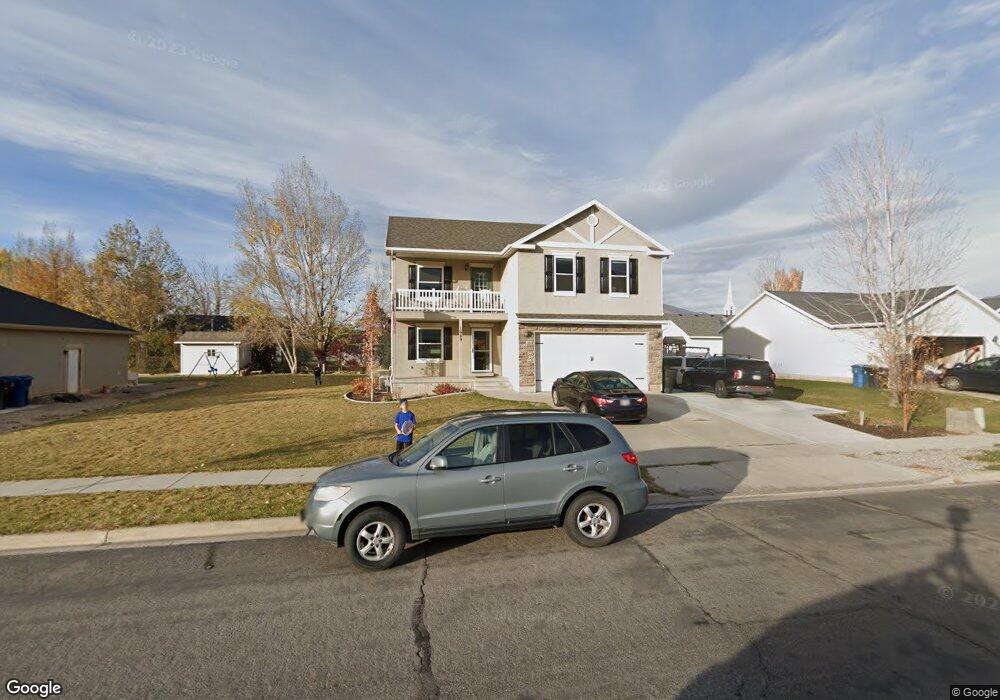
1669 E 1240 S Unit 12 Spanish Fork, UT 84660
Estimated Value: $556,000 - $807,000
4
Beds
7
Baths
3,388
Sq Ft
$203/Sq Ft
Est. Value
About This Home
This home is located at 1669 E 1240 S Unit 12, Spanish Fork, UT 84660 and is currently estimated at $689,305, approximately $203 per square foot. 1669 E 1240 S Unit 12 is a home located in Utah County with nearby schools including Canyon Elementary School, Spanish Fork Jr High School, and Spanish Fork High School.
Ownership History
Date
Name
Owned For
Owner Type
Purchase Details
Closed on
Jun 7, 2020
Sold by
Francis Questin T and Francis Beth A
Bought by
Francis Questin T and Francis Beth A
Current Estimated Value
Purchase Details
Closed on
Sep 23, 2003
Sold by
J2 Homes Inc
Bought by
Francis Questin T and Francis Beth A
Home Financials for this Owner
Home Financials are based on the most recent Mortgage that was taken out on this home.
Original Mortgage
$168,710
Outstanding Balance
$77,888
Interest Rate
6.17%
Mortgage Type
FHA
Estimated Equity
$611,417
Purchase Details
Closed on
Jun 3, 2003
Sold by
Creer William N and Creer Larae W
Bought by
J2 Homes Inc
Home Financials for this Owner
Home Financials are based on the most recent Mortgage that was taken out on this home.
Original Mortgage
$144,000
Interest Rate
5.71%
Mortgage Type
Construction
Create a Home Valuation Report for This Property
The Home Valuation Report is an in-depth analysis detailing your home's value as well as a comparison with similar homes in the area
Home Values in the Area
Average Home Value in this Area
Purchase History
| Date | Buyer | Sale Price | Title Company |
|---|---|---|---|
| Francis Questin T | -- | None Available | |
| Francis Questin T | -- | Mountain West Title Co | |
| J2 Homes Inc | -- | First American Title Co |
Source: Public Records
Mortgage History
| Date | Status | Borrower | Loan Amount |
|---|---|---|---|
| Open | Francis Questin T | $168,710 | |
| Previous Owner | J2 Homes Inc | $144,000 |
Source: Public Records
Tax History Compared to Growth
Tax History
| Year | Tax Paid | Tax Assessment Tax Assessment Total Assessment is a certain percentage of the fair market value that is determined by local assessors to be the total taxable value of land and additions on the property. | Land | Improvement |
|---|---|---|---|---|
| 2025 | $2,996 | $363,825 | $200,100 | $461,400 |
| 2024 | $3,043 | $308,770 | $0 | $0 |
| 2023 | $3,043 | $314,050 | $0 | $0 |
| 2022 | $3,362 | $340,285 | $0 | $0 |
| 2021 | $2,972 | $481,100 | $119,500 | $361,600 |
| 2020 | $2,095 | $329,800 | $108,600 | $221,200 |
| 2019 | $1,864 | $308,700 | $90,500 | $218,200 |
| 2018 | $1,820 | $291,400 | $85,400 | $206,000 |
| 2017 | $1,656 | $142,505 | $0 | $0 |
| 2016 | $1,543 | $131,010 | $0 | $0 |
| 2015 | $1,408 | $118,085 | $0 | $0 |
| 2014 | $1,325 | $111,595 | $0 | $0 |
Source: Public Records
Map
Nearby Homes
- 1112 S 1660 E
- 1033 S 1560 E
- 357 E 1460 S Unit 45
- 385 E 1460 S Unit 47
- 379 E 1460 S Unit 46
- 1591 E 1550 S
- 1931 E 1400 S
- 938 S 1740 E
- 1093 S 1960 E
- 417 E 1460 S Unit 48
- 332 E 1460 S Unit 56
- 1341 E 1670 S Unit 819
- 1333 E 1670 S Unit 816
- 1339 E 1670 S Unit 818
- 1334 E 1670 S Unit 822
- 1296 E 1670 S Unit 910
- 1336 E 1670 S Unit 821
- 1337 E 1670 S Unit 817
- 1338 E 1670 S Unit 820
- 1332 E 1670 S Unit 823
- 1669 E 1240 S
- 1647 E 1240 S
- 1647 E 1240 S Unit 11
- 1683 E 1240 S
- 1683 E 1240 S Unit 13
- 1656 E 1180 S
- 1192 S 1700 E
- 1621 E 1240 S
- 1621 E 1240 S Unit 10
- 1638 E 1180 S
- 1176 S 1700 E
- 1587 E 1240 S
- 1587 E 1240 S Unit 9
- 1572 E 1180 S
- 1169 S 1660 E
- 1176 S 1660 E
- 1168 S 1700 E
- 1705 E 1310 S
- 1175 S 1560 E
- 1164 S 1660 E