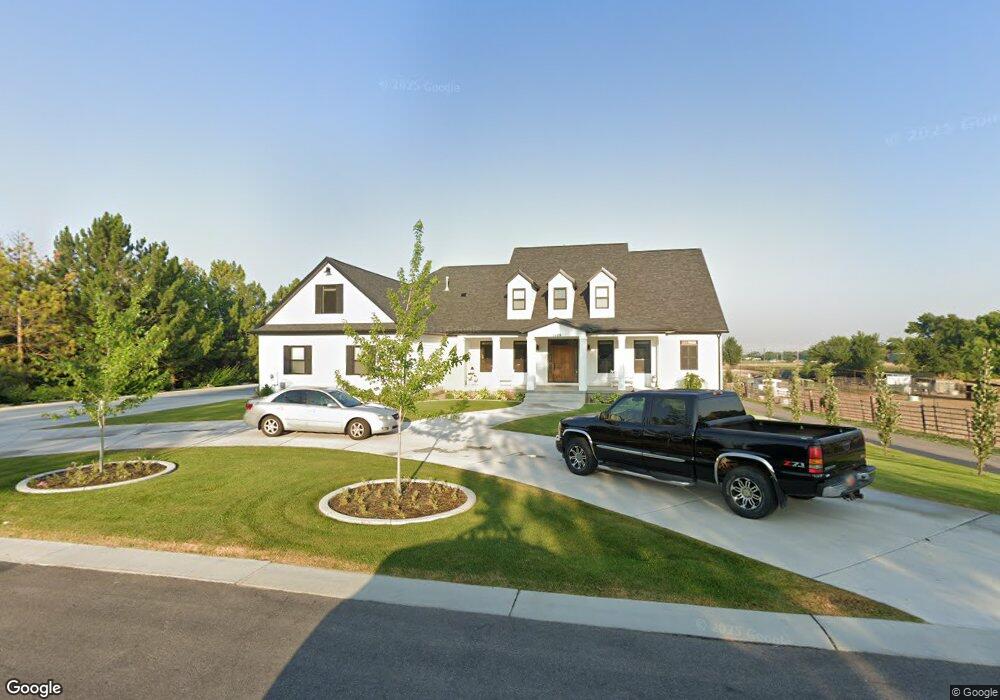
1669 N 1000 E Unit 6 North Logan, UT 84341
Estimated Value: $1,347,000 - $1,741,183
--
Bed
--
Bath
5,012
Sq Ft
$307/Sq Ft
Est. Value
About This Home
This home is located at 1669 N 1000 E Unit 6, North Logan, UT 84341 and is currently estimated at $1,538,728, approximately $307 per square foot. 1669 N 1000 E Unit 6 is a home located in Cache County with nearby schools including Greenville School, Cedar Ridge School, and Cedar Ridge Middle School.
Ownership History
Date
Name
Owned For
Owner Type
Purchase Details
Closed on
Oct 7, 2021
Sold by
Hansen Mark T and Hansen Rebecca J
Bought by
Hansen Mark T and Hansen Rebecca J
Current Estimated Value
Home Financials for this Owner
Home Financials are based on the most recent Mortgage that was taken out on this home.
Original Mortgage
$548,250
Outstanding Balance
$415,661
Interest Rate
2.1%
Mortgage Type
New Conventional
Estimated Equity
$1,123,067
Purchase Details
Closed on
Jun 14, 2016
Sold by
Griffiths Brent H and Griffiths Sandi
Bought by
Hansen Mark T and Hansen Rebecca J
Home Financials for this Owner
Home Financials are based on the most recent Mortgage that was taken out on this home.
Original Mortgage
$118,500
Interest Rate
3.58%
Mortgage Type
Commercial
Create a Home Valuation Report for This Property
The Home Valuation Report is an in-depth analysis detailing your home's value as well as a comparison with similar homes in the area
Home Values in the Area
Average Home Value in this Area
Purchase History
| Date | Buyer | Sale Price | Title Company |
|---|---|---|---|
| Hansen Mark T | -- | Pinnacle Title | |
| Hansen Mark T | -- | Pinnacle Title | |
| Hansen Mark T | -- | Pinnacle Title |
Source: Public Records
Mortgage History
| Date | Status | Borrower | Loan Amount |
|---|---|---|---|
| Open | Hansen Mark T | $548,250 | |
| Closed | Hansen Mark T | $548,250 | |
| Previous Owner | Hansen Mark T | $118,500 |
Source: Public Records
Tax History Compared to Growth
Tax History
| Year | Tax Paid | Tax Assessment Tax Assessment Total Assessment is a certain percentage of the fair market value that is determined by local assessors to be the total taxable value of land and additions on the property. | Land | Improvement |
|---|---|---|---|---|
| 2025 | $5,321 | $744,860 | $0 | $0 |
| 2024 | $5,652 | $736,275 | $0 | $0 |
| 2023 | $5,671 | $691,250 | $0 | $0 |
| 2022 | $5,338 | $621,750 | $0 | $0 |
| 2021 | $1,591 | $158,050 | $158,050 | $0 |
| 2020 | $1,697 | $158,050 | $158,050 | $0 |
| 2019 | $1,777 | $158,050 | $158,050 | $0 |
| 2018 | $1,833 | $158,050 | $158,050 | $0 |
| 2017 | $1,915 | $158,050 | $0 | $0 |
| 2016 | $1,945 | $106,200 | $0 | $0 |
| 2015 | $1,312 | $106,200 | $0 | $0 |
| 2014 | $1,281 | $106,200 | $0 | $0 |
| 2013 | -- | $106,200 | $0 | $0 |
Source: Public Records
Map
Nearby Homes
- 1963 N 1000 E
- 1285 E 1600 N
- Sydney Plan at Mountainside Estates
- Providence Plan at Mountainside Estates
- Maryland Plan at Mountainside Estates
- Rochester Plan at Mountainside Estates
- Oakley Plan at Mountainside Estates
- Harmony Plan at Mountainside Estates
- 1374 N 1250 E
- 1395 E Talmage Ln Unit 31
- 1901 N 1380 E
- 2143 N 950 E
- 1366 N Talmage Ln Unit 35
- 1362 N 1250 E
- 1454 N 1400 E
- 653 E 1280 N
- 643 E 1280 N
- 648 E 1280 N
- 1593 N 110 W Unit 201
- 611 E 2450 N Unit 1