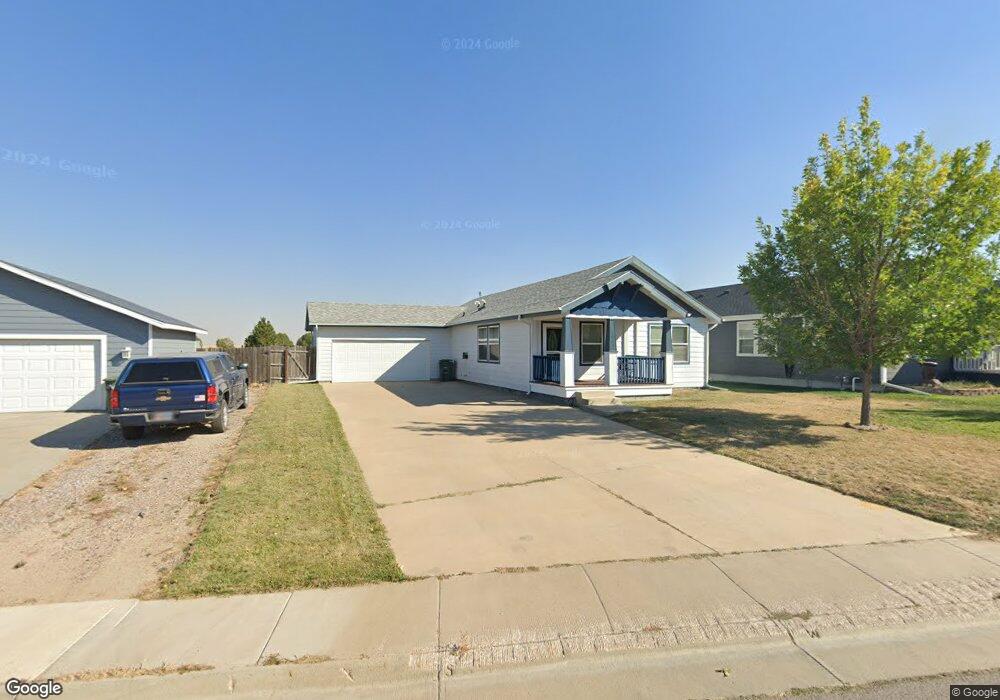
1669 Pathfinder Cir Gillette, WY 82716
Estimated Value: $275,000 - $305,000
3
Beds
2
Baths
1,456
Sq Ft
$201/Sq Ft
Est. Value
About This Home
This home is located at 1669 Pathfinder Cir, Gillette, WY 82716 and is currently estimated at $292,149, approximately $200 per square foot. 1669 Pathfinder Cir is a home located in Campbell County with nearby schools including Westwood High School, Lakeview Elementary School, and Twin Spruce Junior High School.
Ownership History
Date
Name
Owned For
Owner Type
Purchase Details
Closed on
Sep 27, 2024
Sold by
Golden Development Llc
Bought by
Blakeman Troy and Blakeman Barbara
Current Estimated Value
Home Financials for this Owner
Home Financials are based on the most recent Mortgage that was taken out on this home.
Original Mortgage
$281,310
Outstanding Balance
$278,430
Interest Rate
6.49%
Mortgage Type
FHA
Estimated Equity
$13,719
Purchase Details
Closed on
Jan 11, 2023
Sold by
Campbell County Sheriff
Bought by
Golden Development Llc
Purchase Details
Closed on
Jun 29, 2006
Sold by
Pacific Single Family Llc
Bought by
Hartmann David J
Home Financials for this Owner
Home Financials are based on the most recent Mortgage that was taken out on this home.
Original Mortgage
$174,900
Interest Rate
6.58%
Mortgage Type
New Conventional
Create a Home Valuation Report for This Property
The Home Valuation Report is an in-depth analysis detailing your home's value as well as a comparison with similar homes in the area
Home Values in the Area
Average Home Value in this Area
Purchase History
| Date | Buyer | Sale Price | Title Company |
|---|---|---|---|
| Blakeman Troy | -- | None Listed On Document | |
| Golden Development Llc | -- | None Listed On Document | |
| Golden Development Llc | -- | -- | |
| Hartmann David J | -- | None Available |
Source: Public Records
Mortgage History
| Date | Status | Borrower | Loan Amount |
|---|---|---|---|
| Open | Blakeman Troy | $281,310 | |
| Previous Owner | Hartmann David J | $174,900 |
Source: Public Records
Tax History Compared to Growth
Tax History
| Year | Tax Paid | Tax Assessment Tax Assessment Total Assessment is a certain percentage of the fair market value that is determined by local assessors to be the total taxable value of land and additions on the property. | Land | Improvement |
|---|---|---|---|---|
| 2025 | $1,466 | $18,616 | $3,358 | $15,258 |
| 2024 | $1,466 | $20,853 | $4,411 | $16,442 |
| 2023 | $1,420 | $20,189 | $4,379 | $15,810 |
| 2022 | $1,307 | $18,525 | $3,950 | $14,575 |
| 2021 | $0 | $16,812 | $3,904 | $12,908 |
| 2020 | $1,138 | $16,727 | $3,904 | $12,823 |
| 2019 | $1,140 | $16,790 | $3,904 | $12,886 |
| 2018 | $1,104 | $16,330 | $3,904 | $12,426 |
| 2017 | $1,103 | $16,342 | $3,954 | $12,388 |
| 2016 | $1,177 | $17,418 | $3,954 | $13,464 |
| 2015 | -- | $16,420 | $3,954 | $12,466 |
| 2014 | -- | $15,609 | $3,954 | $11,655 |
Source: Public Records
Map
Nearby Homes
- 1306 Estes Ln
- 614 Arcadia Ave
- 701 Lakeland Hills Dr
- 709 Lakeland Hills Dr
- 1126 Estes Ln
- 1113 Estes Ln
- 1117 Estes Ln
- 1147 Estes Ln
- 514 Brendan Way
- Lot 1b Kluver Rd
- 728 Lakeland Hills Dr
- 734 Lakeland Hills Dr
- 49 Independence Dr
- 610 Chase Ct
- 62 American Ln
- 609 C Chase Ct
- 1503 E Rawhide Dr
- 605 Chase Ct
- 403 Meadow Rose Ave
- 1505 Helena Ave
- 1671 Pathfinder Cir
- 1667 Pathfinder Cir
- 1665 Pathfinder Cir
- 1673 Pathfinder Cir
- 1663 Pathfinder Cir
- 1666 Pathfinder Cir
- 1668 Pathfinder Cir
- 1664 Pathfinder Cir
- 1670 Pathfinder Cir
- 1661 Pathfinder Cir
- 1662 Pathfinder Cir
- 1672 Pathfinder Cir
- 1674 Pathfinder Cir
- 1660 Pathfinder Cir
- 1659 Pathfinder Cir
- 1608 Pathfinder Cir
- 1610 Pathfinder Cir
- 1606 Pathfinder Cir
- 1658 Pathfinder Cir
- 1604 Pathfinder Cir