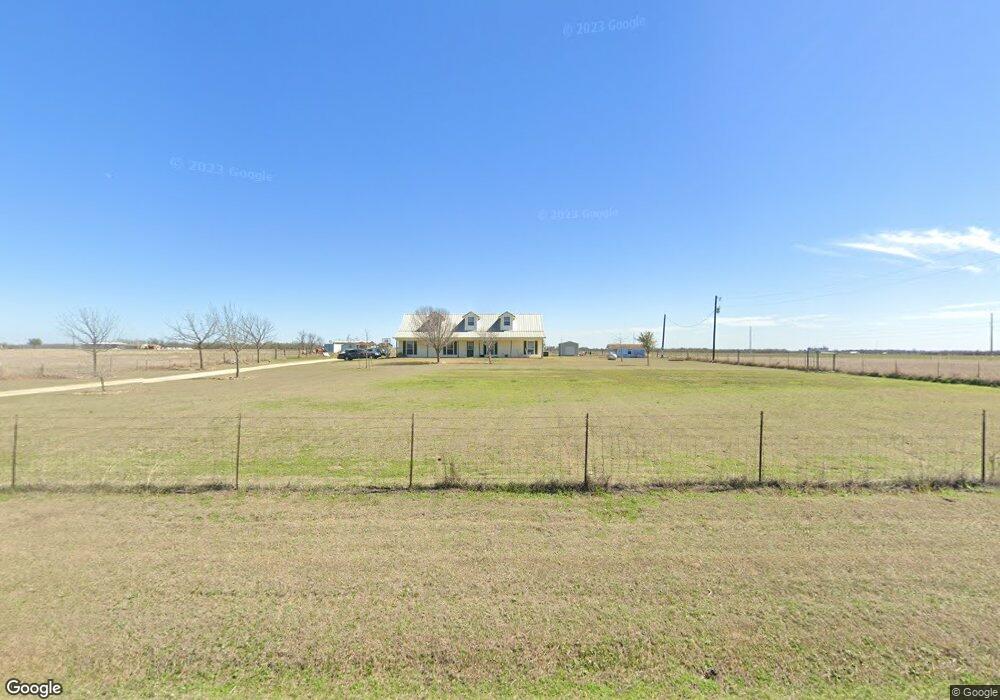
1669 Stone Rd Temple, TX 76501
Estimated Value: $399,000 - $644,000
4
Beds
2
Baths
2,205
Sq Ft
$232/Sq Ft
Est. Value
About This Home
This home is located at 1669 Stone Rd, Temple, TX 76501 and is currently estimated at $512,205, approximately $232 per square foot. 1669 Stone Rd is a home located in Bell County with nearby schools including Rogers Elementary School, Rogers Middle, and Rogers High School.
Ownership History
Date
Name
Owned For
Owner Type
Purchase Details
Closed on
Jul 15, 2022
Sold by
Caldwell Keith A and Caldwell Shannon N
Bought by
Droptine Investments Llc
Current Estimated Value
Purchase Details
Closed on
Oct 13, 2010
Sold by
Vaughan Trent Ross and Vaughan Ashley May
Bought by
Caldwell Keith A and Caldwell Shannon N
Home Financials for this Owner
Home Financials are based on the most recent Mortgage that was taken out on this home.
Original Mortgage
$247,046
Interest Rate
4.39%
Mortgage Type
New Conventional
Purchase Details
Closed on
Oct 2, 2010
Sold by
Vaughan Paul Ray and Vaughan Sally P
Bought by
Vaughan Trenton Ross and Vaughan Ashley May
Home Financials for this Owner
Home Financials are based on the most recent Mortgage that was taken out on this home.
Original Mortgage
$247,046
Interest Rate
4.39%
Mortgage Type
New Conventional
Create a Home Valuation Report for This Property
The Home Valuation Report is an in-depth analysis detailing your home's value as well as a comparison with similar homes in the area
Home Values in the Area
Average Home Value in this Area
Purchase History
| Date | Buyer | Sale Price | Title Company |
|---|---|---|---|
| Droptine Investments Llc | -- | Baird Crews Schiller & Whitake | |
| Caldwell Keith A | -- | Monteith Abstract & Title Co | |
| Vaughan Trenton Ross | -- | Monteith Abstract & Title Co |
Source: Public Records
Mortgage History
| Date | Status | Borrower | Loan Amount |
|---|---|---|---|
| Previous Owner | Caldwell Keith A | $247,046 | |
| Closed | Vaughan Trenton Ross | $0 |
Source: Public Records
Tax History Compared to Growth
Tax History
| Year | Tax Paid | Tax Assessment Tax Assessment Total Assessment is a certain percentage of the fair market value that is determined by local assessors to be the total taxable value of land and additions on the property. | Land | Improvement |
|---|---|---|---|---|
| 2025 | $3,262 | $356,234 | -- | -- |
| 2024 | $3,262 | $298,185 | -- | -- |
| 2023 | $3,898 | $271,939 | $0 | $0 |
| 2022 | $4,019 | $248,290 | $18,250 | $230,040 |
| 2021 | $3,956 | $342,267 | $126,382 | $215,885 |
| 2020 | $3,742 | $315,443 | $126,382 | $189,061 |
| 2019 | $4,496 | $332,339 | $105,610 | $226,729 |
| 2018 | $4,244 | $295,064 | $82,531 | $212,533 |
| 2017 | $4,292 | $282,440 | $73,877 | $208,563 |
| 2016 | $4,135 | $264,027 | $62,868 | $201,159 |
| 2014 | $3,125 | $229,294 | $0 | $0 |
Source: Public Records
Map
Nearby Homes
- 916 Stone Rd
- 14308 Fm 2904
- Tract 3C Airville Rd
- Tract 4 Airville Rd
- TBD Airville Rd
- 3830 Content School Rd
- 310 Hruskaville Rd
- 3510 Cen-Tex Loop
- 0 Tract 3a Fm 2904 Rd Unit 576674
- 0 Tract 3a Fm 2904 Rd Unit 559438
- 3177 Airville Rd
- 0 Tract 4
- 11247 Farm-To-market 2086
- TBD Texas 53
- Dove Lot: 0000 Texas 53
- Bluebonnet Lot: 0000 Texas 53
- Alamo Lot: 0000 Texas 53
- 3515 Stone Rd
- 0000 Texas 53
- TBD Texas 53