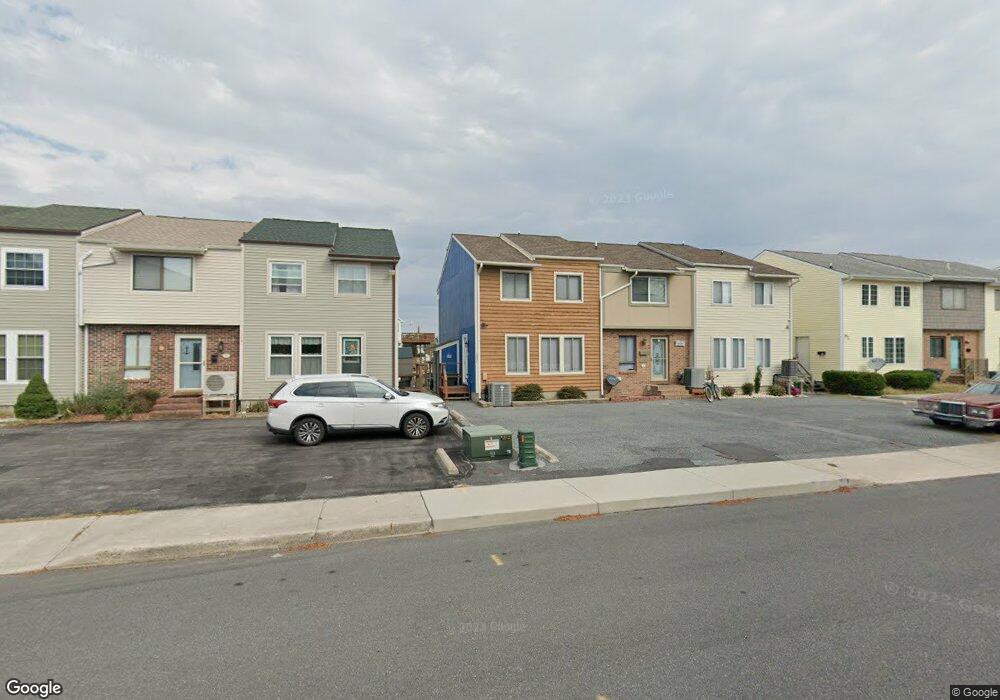
166C Captains Quarters Rd Ocean City, MD 21842
Estimated Value: $463,000 - $560,130
3
Beds
3
Baths
1,225
Sq Ft
$416/Sq Ft
Est. Value
About This Home
This home is located at 166C Captains Quarters Rd, Ocean City, MD 21842 and is currently estimated at $510,033, approximately $416 per square foot. 166C Captains Quarters Rd is a home located in Worcester County with nearby schools including Ocean City Elementary School, Stephen Decatur Middle School, and Berlin Intermediate School.
Ownership History
Date
Name
Owned For
Owner Type
Purchase Details
Closed on
Oct 19, 2018
Sold by
Podles Edward A and Podles Ruth E
Bought by
Sohn Bernadette I
Current Estimated Value
Home Financials for this Owner
Home Financials are based on the most recent Mortgage that was taken out on this home.
Original Mortgage
$182,000
Outstanding Balance
$159,053
Interest Rate
4.6%
Mortgage Type
Stand Alone First
Estimated Equity
$350,980
Purchase Details
Closed on
Jun 26, 2009
Sold by
Kozlowski Joseph C
Bought by
Podles Edward A and Podles Ruth E
Home Financials for this Owner
Home Financials are based on the most recent Mortgage that was taken out on this home.
Original Mortgage
$223,125
Interest Rate
4.93%
Purchase Details
Closed on
Feb 23, 2000
Sold by
Winkler Stephen Jay
Bought by
Kozlowski Joseph C Sr
Purchase Details
Closed on
Jan 6, 1999
Sold by
Jay Winkler Stephen
Bought by
Winkler Stephen Jay
Create a Home Valuation Report for This Property
The Home Valuation Report is an in-depth analysis detailing your home's value as well as a comparison with similar homes in the area
Home Values in the Area
Average Home Value in this Area
Purchase History
| Date | Buyer | Sale Price | Title Company |
|---|---|---|---|
| Sohn Bernadette I | $276,000 | Resort Land Title & Escrow | |
| Podles Edward A | $297,500 | -- | |
| Kozlowski Joseph C Sr | $104,000 | -- | |
| Winkler Stephen Jay | -- | -- |
Source: Public Records
Mortgage History
| Date | Status | Borrower | Loan Amount |
|---|---|---|---|
| Open | Sohn Bernadette I | $182,000 | |
| Previous Owner | Podles Edward A | $223,125 | |
| Closed | Kozlowski Joseph C Sr | -- |
Source: Public Records
Tax History Compared to Growth
Tax History
| Year | Tax Paid | Tax Assessment Tax Assessment Total Assessment is a certain percentage of the fair market value that is determined by local assessors to be the total taxable value of land and additions on the property. | Land | Improvement |
|---|---|---|---|---|
| 2025 | $4,199 | $337,167 | $0 | $0 |
| 2024 | $4,199 | $300,933 | $0 | $0 |
| 2023 | $3,720 | $264,700 | $150,000 | $114,700 |
| 2022 | $3,581 | $254,800 | $0 | $0 |
| 2021 | $3,461 | $244,900 | $0 | $0 |
| 2020 | $3,320 | $235,000 | $150,000 | $85,000 |
| 2019 | $3,330 | $234,800 | $0 | $0 |
| 2018 | $3,304 | $234,600 | $0 | $0 |
| 2017 | $3,246 | $234,400 | $0 | $0 |
| 2016 | -- | $228,667 | $0 | $0 |
| 2015 | $3,687 | $222,933 | $0 | $0 |
| 2014 | $3,687 | $217,200 | $0 | $0 |
Source: Public Records
Map
Nearby Homes
- 160 Captains Quarters Rd
- 153 Captains Quarters Rd
- 161 Captains Quarters Rd Unit 103
- 8 Newport Bay Dr Unit 8
- 170 Captains Quarters Rd Unit 201
- 210A Windward Dr
- 169 Jamestown Rd Unit 503
- 169 Jamestown Rd
- 169 Jamestown Rd
- 202 S Heron Dr Unit 101BP
- 201 S Heron Dr Unit B16
- 201 S Heron Dr Unit 5G
- 201 S Heron Dr
- 201 S Heron Dr Unit 3C
- 201 S Heron Dr Unit 11E
- 134 Captains Quarters Rd Unit 5
- 105 120th St Unit 37
- 105 120th St Unit 8A
- 105 120th St Unit 38A5
- 105 120th St Unit 131B
- 166 Captains Quarters Rd Unit 115B
- 166 Captains Quarters Rd Unit C
- 166 Captains Quarters Rd Unit B 115B
- 166 Captains Quarters Rd
- 166 Captains Quarters Rd Unit B
- 162 Captains Quarters Rd
- 166B Captains Quarters Rd
- 162 Captains Quarters Rd Unit C
- 162 Captains Quarters Rd Unit A
- 162 Captains Quarters Rd Unit B
- 166A Captains Quarters Rd
- 162B Captains Quarters Rd
- 164C Captains Quarters Rd
- 162A Captains Quarters Rd
- 164B Captains Quarters Rd
- 160 Captains Quarters Rd Unit A
- 160 Captains Quarters Rd Unit B
- 160 Captains Quarters Rd Unit C
- 164 Captains Quarters Rd
- 164 Captains Quarters Rd Unit A