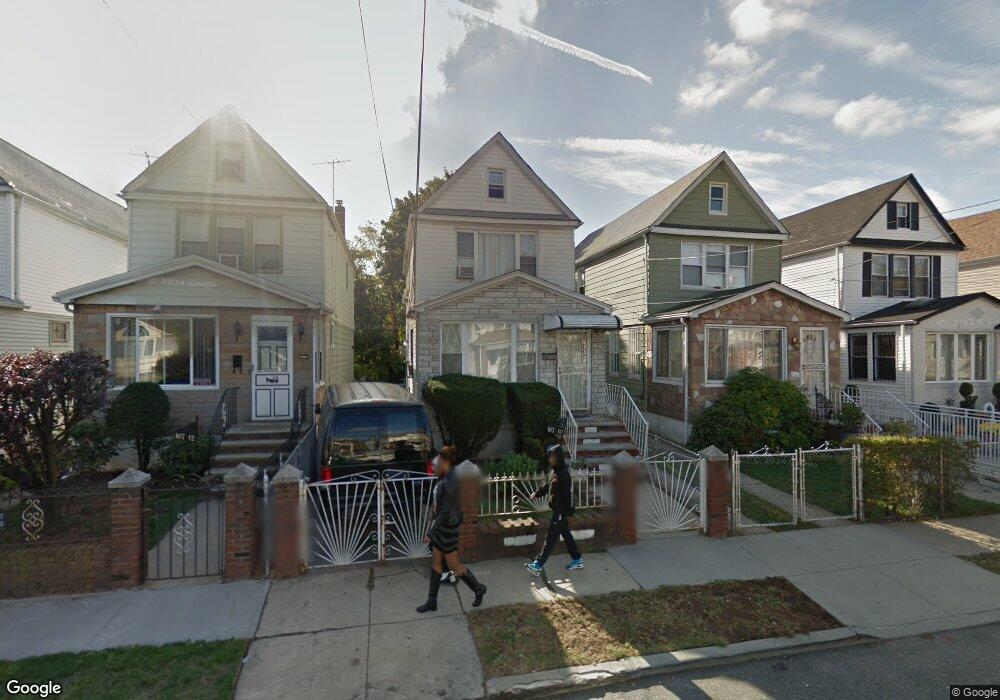
167-10 111th Ave Jamaica, NY 11433
Jamaica NeighborhoodEstimated Value: $690,919 - $756,000
3
Beds
2
Baths
1,552
Sq Ft
$465/Sq Ft
Est. Value
About This Home
This home is located at 167-10 111th Ave, Jamaica, NY 11433 and is currently estimated at $722,230, approximately $465 per square foot. 167-10 111th Ave is a home located in Queens County with nearby schools including P.S. 140 - Edward K. Ellington, Junior High School 8 Richard S Grossley, and Allen Christian School.
Ownership History
Date
Name
Owned For
Owner Type
Purchase Details
Closed on
Mar 25, 2022
Sold by
Farquharson Winsome
Bought by
Miller Winsome
Current Estimated Value
Home Financials for this Owner
Home Financials are based on the most recent Mortgage that was taken out on this home.
Original Mortgage
$409,500
Interest Rate
6.33%
Mortgage Type
Purchase Money Mortgage
Purchase Details
Closed on
Dec 17, 1999
Sold by
Exodus Development Corp
Bought by
Farquharson Winsome
Home Financials for this Owner
Home Financials are based on the most recent Mortgage that was taken out on this home.
Original Mortgage
$195,250
Interest Rate
7.84%
Mortgage Type
FHA
Purchase Details
Closed on
Oct 11, 1999
Sold by
Reavis Betty
Bought by
Exodus Development Corp
Create a Home Valuation Report for This Property
The Home Valuation Report is an in-depth analysis detailing your home's value as well as a comparison with similar homes in the area
Home Values in the Area
Average Home Value in this Area
Purchase History
| Date | Buyer | Sale Price | Title Company |
|---|---|---|---|
| Miller Winsome | -- | -- | |
| Miller Winsome | -- | -- | |
| Miller Winsome | -- | -- | |
| Farquharson Winsome | $197,000 | Commonwealth Land Title Ins | |
| Farquharson Winsome | $197,000 | Commonwealth Land Title Ins | |
| Exodus Development Corp | $5,000 | Commonwealth Land Title Ins | |
| Exodus Development Corp | $5,000 | Commonwealth Land Title Ins |
Source: Public Records
Mortgage History
| Date | Status | Borrower | Loan Amount |
|---|---|---|---|
| Previous Owner | Miller Winsome | $409,500 | |
| Previous Owner | Farquharson Winsome | $195,250 |
Source: Public Records
Tax History Compared to Growth
Tax History
| Year | Tax Paid | Tax Assessment Tax Assessment Total Assessment is a certain percentage of the fair market value that is determined by local assessors to be the total taxable value of land and additions on the property. | Land | Improvement |
|---|---|---|---|---|
| 2025 | $3,713 | $19,561 | $4,468 | $15,093 |
| 2024 | $3,713 | $18,486 | $4,732 | $13,754 |
| 2023 | $3,670 | $18,270 | $4,252 | $14,018 |
| 2022 | $3,447 | $38,820 | $10,320 | $28,500 |
| 2021 | $3,431 | $32,160 | $10,320 | $21,840 |
| 2020 | $3,450 | $27,660 | $10,320 | $17,340 |
| 2019 | $3,223 | $29,340 | $10,320 | $19,020 |
| 2018 | $3,104 | $15,225 | $5,755 | $9,470 |
| 2017 | $2,933 | $14,389 | $5,978 | $8,411 |
| 2016 | $2,716 | $14,389 | $5,978 | $8,411 |
| 2015 | $1,637 | $13,584 | $6,375 | $7,209 |
| 2014 | $1,637 | $12,838 | $6,718 | $6,120 |
Source: Public Records
Map
Nearby Homes
- 11047 166th St
- 168-02 110th Rd
- 111-19 169th St
- 110-31 166th St
- 167-25 110th Rd
- 11157 166th St
- 110-19 169th St
- 11003 164th Place
- 112-35 168th St
- 16427 109th Dr
- 167-17 Linden Blvd
- 16737 109th Rd
- 16310 Mathias Ave
- 109-15 169th Place
- 110-04 164th St
- 0 Guy R Brewer Blvd Unit KEY932885
- 10909 169th Place
- 11008 172nd St
- 17210 111th Ave
- 110-03 Guy R Brewer Blvd Unit 40
- 16710 111th Ave
- 16712 111th Ave
- 16708 111th Ave
- 167-12 111th Ave
- 16714 111th Ave
- 167-14 111th Ave
- 16706 111th Ave
- 167-06 111th Ave
- 16716 111th Ave
- 111-16 168th St
- 16704 111th Ave
- 167-04 111th Ave
- 11112 168th St
- 11111 167th St
- 16702 111th Ave
- 167-02 111th Ave
- 111-13 167th St Unit 2nd Fl
- 111-13 167th St
- 11113 167th St
- 11116 168th St