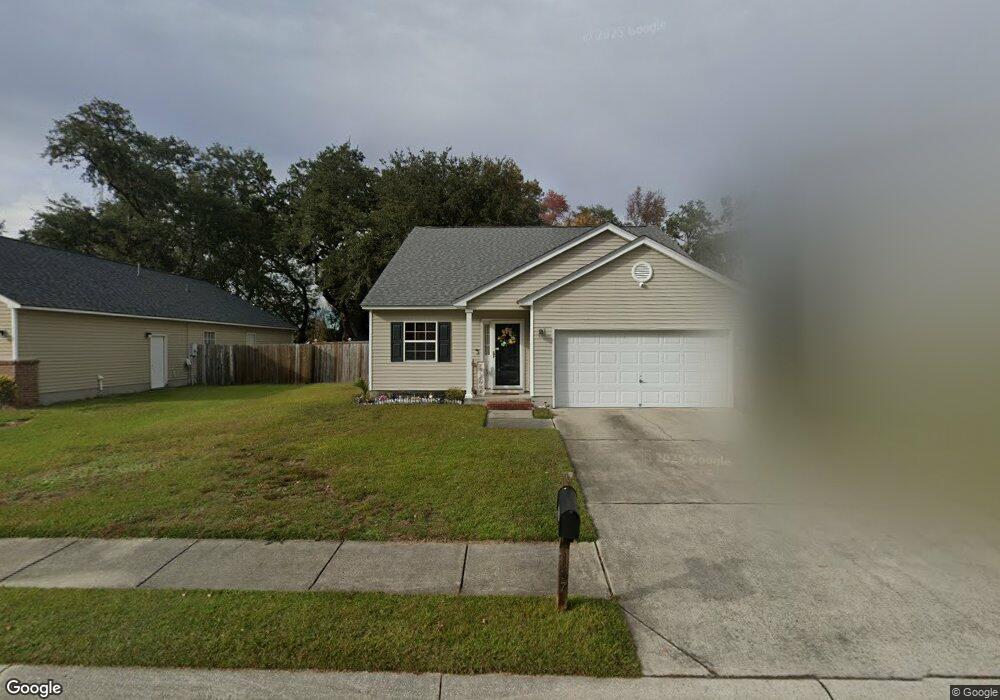
167 Balbriggan Dr Goose Creek, SC 29445
Estimated Value: $312,109 - $358,000
--
Bed
--
Bath
1,732
Sq Ft
$194/Sq Ft
Est. Value
About This Home
This home is located at 167 Balbriggan Dr, Goose Creek, SC 29445 and is currently estimated at $335,277, approximately $193 per square foot. 167 Balbriggan Dr is a home located in Berkeley County with nearby schools including Devon Forest Elementary School, Westview Middle School, and Stratford High School.
Ownership History
Date
Name
Owned For
Owner Type
Purchase Details
Closed on
Mar 8, 2021
Sold by
Porter Jo Ann and Porter Joann
Bought by
Porter Jo Ann
Current Estimated Value
Home Financials for this Owner
Home Financials are based on the most recent Mortgage that was taken out on this home.
Original Mortgage
$156,900
Outstanding Balance
$141,122
Interest Rate
2.9%
Mortgage Type
New Conventional
Estimated Equity
$194,155
Purchase Details
Closed on
Mar 24, 2006
Sold by
Gavins Stephanie April
Bought by
Porter Joann
Home Financials for this Owner
Home Financials are based on the most recent Mortgage that was taken out on this home.
Original Mortgage
$160,200
Interest Rate
2%
Mortgage Type
Adjustable Rate Mortgage/ARM
Purchase Details
Closed on
Jul 6, 2004
Sold by
Centex Homes
Bought by
Gavins Stephanie April
Create a Home Valuation Report for This Property
The Home Valuation Report is an in-depth analysis detailing your home's value as well as a comparison with similar homes in the area
Home Values in the Area
Average Home Value in this Area
Purchase History
| Date | Buyer | Sale Price | Title Company |
|---|---|---|---|
| Porter Jo Ann | -- | Boston National Ttl Agcy Llc | |
| Porter Jo Ann | -- | Boston National Title | |
| Porter Joann | $178,000 | None Available | |
| Gavins Stephanie April | $154,786 | -- |
Source: Public Records
Mortgage History
| Date | Status | Borrower | Loan Amount |
|---|---|---|---|
| Open | Porter Jo Ann | $156,900 | |
| Closed | Porter Jo Ann | $156,900 | |
| Previous Owner | Porter Joann | $160,200 |
Source: Public Records
Tax History Compared to Growth
Tax History
| Year | Tax Paid | Tax Assessment Tax Assessment Total Assessment is a certain percentage of the fair market value that is determined by local assessors to be the total taxable value of land and additions on the property. | Land | Improvement |
|---|---|---|---|---|
| 2025 | $1,107 | $195,598 | $44,100 | $151,498 |
| 2024 | $1,107 | $7,824 | $1,764 | $6,060 |
| 2023 | $1,107 | $7,824 | $1,764 | $6,060 |
| 2022 | $1,086 | $6,804 | $1,446 | $5,358 |
| 2021 | $1,169 | $6,810 | $1,446 | $5,358 |
| 2020 | $1,118 | $6,804 | $1,446 | $5,358 |
| 2019 | $1,068 | $6,804 | $1,446 | $5,358 |
| 2018 | $976 | $5,916 | $1,400 | $4,516 |
| 2017 | $969 | $5,916 | $1,400 | $4,516 |
| 2016 | $976 | $5,920 | $1,400 | $4,520 |
| 2015 | $920 | $5,920 | $1,400 | $4,520 |
| 2014 | $866 | $5,920 | $1,400 | $4,520 |
| 2013 | -- | $5,920 | $1,400 | $4,520 |
Source: Public Records
Map
Nearby Homes
- 117 Macy Cir
- 123 Macy Cir
- 152 Balbriggan Dr
- 127 Davenport St
- 127 Darcy Ave
- 134 Hornby Cir
- 107 Darcy Ave
- 130 Hornby Cir
- 122 Greyson Cir
- 803 Gunston Hall Rd
- 315 Indigo Rd
- 169 Darcy Ave
- 113 Penzance Blvd
- 106 Trimley Ct
- 616 Saint Ives Ln
- 620 Saint Ives Ln
- 190 Darcy Ave
- 110 W Hartwick Ln
- 116 Two Hitch Rd
- 131 Ashton Dr
- 169 Balbriggan Dr
- 165 Balbriggan Dr
- 171 Balbriggan Dr
- 163 Balbriggan Dr
- 125 Taylor Cir Unit 3F
- 144 Balbriggan Dr
- 144 Balbriggan Dr Unit UNFURN
- 144 Balbriggan Dr Unit FURN.
- 124 Taylor Cir
- 123 Taylor Cir Unit 1
- 146 Balbriggan Dr
- 122 Taylor Cir
- 142 Balbriggan Dr
- 121 Taylor Cir
- 120 Taylor Cir
- 173 Balbriggan Dr
- 161 Balbriggan Dr
- 119 Taylor Cir
- 148 Balbriggan Dr
- 118 Taylor Cir