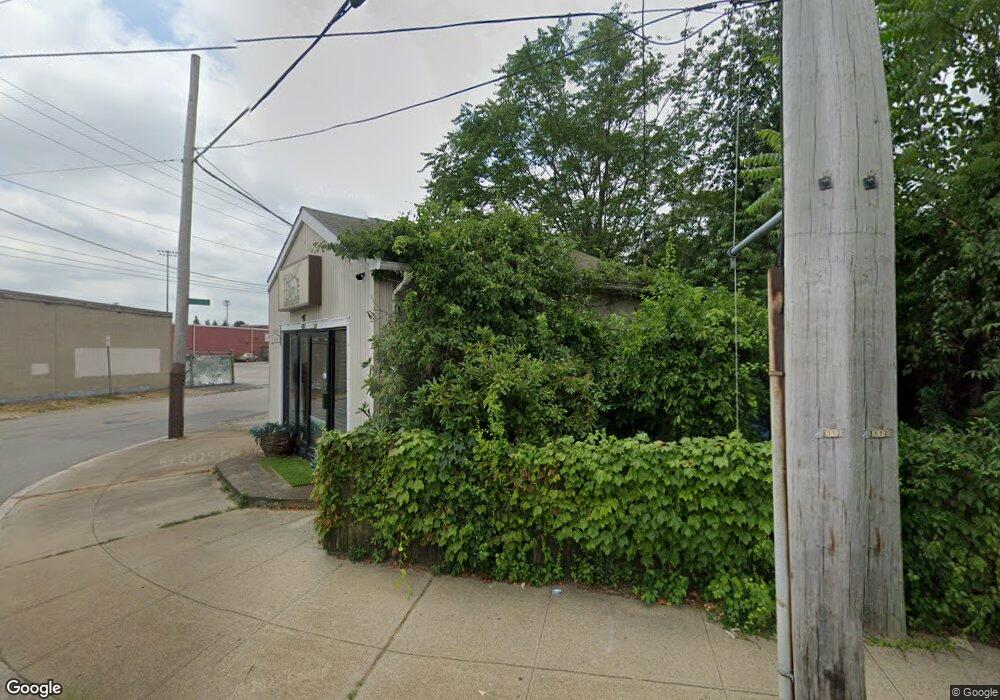
167 Columbus Ave Pawtucket, RI 02860
Beverage Hill-The Plains NeighborhoodEstimated Value: $119,115
--
Bed
--
Bath
2,100
Sq Ft
$57/Sq Ft
Est. Value
About This Home
This home is located at 167 Columbus Ave, Pawtucket, RI 02860 and is currently estimated at $119,115, approximately $56 per square foot. 167 Columbus Ave is a home located in Providence County.
Ownership History
Date
Name
Owned For
Owner Type
Purchase Details
Closed on
Jul 17, 2025
Sold by
Pawtucket City Of
Bought by
Abby Realty Lcl
Current Estimated Value
Purchase Details
Closed on
Jun 17, 2024
Sold by
Pawtucket City Of
Bought by
Brayton Foundry Bldg Corp
Purchase Details
Closed on
Jun 13, 2022
Sold by
Pawtucket City Of
Bought by
Cunha Michael F
Purchase Details
Closed on
Jul 11, 2019
Sold by
Pawtucket City Of
Bought by
Victor Realty Rigp
Purchase Details
Closed on
Oct 2, 2009
Sold by
Healey Robert J
Bought by
Garvin Grant
Purchase Details
Closed on
Dec 4, 2007
Sold by
Drayer Robert O
Bought by
Healey Robert J
Purchase Details
Closed on
Jun 16, 1993
Sold by
Brennan Robert
Bought by
Drayer Prop Inc
Home Financials for this Owner
Home Financials are based on the most recent Mortgage that was taken out on this home.
Original Mortgage
$45,000
Interest Rate
7.38%
Mortgage Type
Commercial
Create a Home Valuation Report for This Property
The Home Valuation Report is an in-depth analysis detailing your home's value as well as a comparison with similar homes in the area
Home Values in the Area
Average Home Value in this Area
Purchase History
| Date | Buyer | Sale Price | Title Company |
|---|---|---|---|
| Abby Realty Lcl | $3,071 | -- | |
| Abby Realty Lcl | $3,071 | -- | |
| Brayton Foundry Bldg Corp | $3,599 | None Available | |
| Brayton Foundry Bldg Corp | $3,599 | None Available | |
| Brayton Foundry Bldg Corp | $3,599 | None Available | |
| Cunha Michael F | $13,662 | None Available | |
| Cunha Michael F | $13,662 | None Available | |
| Cunha Michael F | $13,662 | None Available | |
| Victor Realty Rigp | $4,042 | -- | |
| Victor Realty Rigp | $4,042 | -- | |
| Victor Realty Rigp | $4,042 | -- | |
| Garvin Grant | $50,000 | -- | |
| Garvin Grant | $50,000 | -- | |
| Healey Robert J | $50,000 | -- | |
| Healey Robert J | $50,000 | -- | |
| Drayer Prop Inc | $90,000 | -- | |
| Drayer Prop Inc | $90,000 | -- |
Source: Public Records
Mortgage History
| Date | Status | Borrower | Loan Amount |
|---|---|---|---|
| Previous Owner | Drayer Prop Inc | $45,000 |
Source: Public Records
Tax History Compared to Growth
Tax History
| Year | Tax Paid | Tax Assessment Tax Assessment Total Assessment is a certain percentage of the fair market value that is determined by local assessors to be the total taxable value of land and additions on the property. | Land | Improvement |
|---|---|---|---|---|
| 2025 | $2,556 | $111,100 | $65,300 | $45,800 |
| 2024 | $2,400 | $111,100 | $65,300 | $45,800 |
| 2023 | $2,903 | $97,900 | $54,100 | $43,800 |
| 2022 | $2,841 | $97,900 | $54,100 | $43,800 |
| 2021 | $2,841 | $97,900 | $54,100 | $43,800 |
| 2020 | $3,457 | $100,300 | $54,100 | $46,200 |
| 2019 | $3,457 | $100,300 | $54,100 | $46,200 |
| 2018 | $3,331 | $100,300 | $54,100 | $46,200 |
| 2017 | $3,603 | $103,300 | $58,500 | $44,800 |
| 2016 | $3,472 | $103,300 | $58,500 | $44,800 |
| 2015 | $3,472 | $103,300 | $58,500 | $44,800 |
| 2014 | $3,554 | $115,100 | $63,600 | $51,500 |
Source: Public Records
Map
Nearby Homes