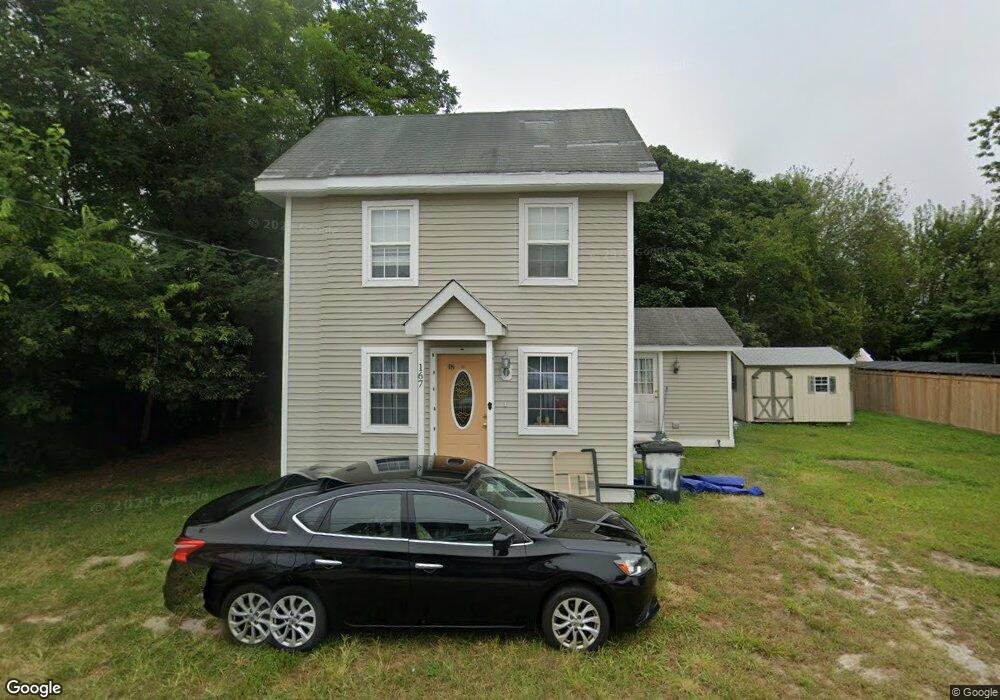
167 High St Leesburg, NJ 08327
Maurice River NeighborhoodEstimated Value: $141,828 - $314,000
Studio
--
Bath
1,046
Sq Ft
$212/Sq Ft
Est. Value
About This Home
This home is located at 167 High St, Leesburg, NJ 08327 and is currently estimated at $221,457, approximately $211 per square foot. 167 High St is a home located in Cumberland County with nearby schools including Maurice River Township Elementary School.
Ownership History
Date
Name
Owned For
Owner Type
Purchase Details
Closed on
Jul 31, 2013
Sold by
Snyder Daniel B and Snyder Patricia B
Bought by
Foss And King Properties Llc
Current Estimated Value
Purchase Details
Closed on
Sep 30, 1998
Sold by
Burns Thelma R
Bought by
Snyder Daniel B and Snyder Patricia B
Home Financials for this Owner
Home Financials are based on the most recent Mortgage that was taken out on this home.
Original Mortgage
$3,425
Interest Rate
6.88%
Create a Home Valuation Report for This Property
The Home Valuation Report is an in-depth analysis detailing your home's value as well as a comparison with similar homes in the area
Home Values in the Area
Average Home Value in this Area
Purchase History
| Date | Buyer | Sale Price | Title Company |
|---|---|---|---|
| Foss And King Properties Llc | $18,500 | Dominion Title Services Inc | |
| Snyder Daniel B | $10,000 | -- |
Source: Public Records
Mortgage History
| Date | Status | Borrower | Loan Amount |
|---|---|---|---|
| Previous Owner | Snyder Daniel B | $3,425 |
Source: Public Records
Tax History
| Year | Tax Paid | Tax Assessment Tax Assessment Total Assessment is a certain percentage of the fair market value that is determined by local assessors to be the total taxable value of land and additions on the property. | Land | Improvement |
|---|---|---|---|---|
| 2025 | $3,299 | $114,000 | $24,800 | $89,200 |
| 2024 | $3,299 | $114,000 | $24,800 | $89,200 |
| 2023 | $2,937 | $100,000 | $24,800 | $75,200 |
| 2022 | $2,947 | $100,000 | $24,800 | $75,200 |
| 2021 | $2,887 | $100,000 | $24,800 | $75,200 |
| 2020 | $2,890 | $100,000 | $24,800 | $75,200 |
| 2019 | $3,219 | $114,000 | $24,800 | $89,200 |
| 2018 | $3,143 | $114,000 | $24,800 | $89,200 |
| 2017 | $3,124 | $114,000 | $24,800 | $89,200 |
| 2016 | $3,040 | $114,000 | $24,800 | $89,200 |
| 2015 | $3,014 | $114,000 | $24,800 | $89,200 |
| 2014 | $2,958 | $114,000 | $24,800 | $89,200 |
Source: Public Records
Map
Nearby Homes
Your Personal Tour Guide
Ask me questions while you tour the home.