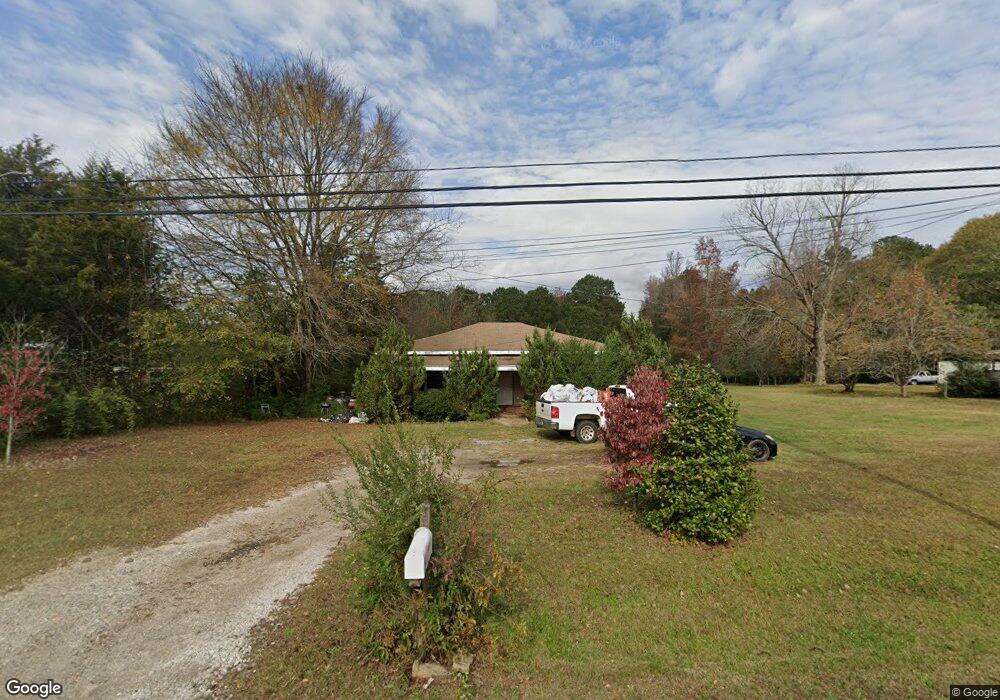
167 Lower Big Springs Rd Lagrange, GA 30241
Estimated Value: $118,000 - $190,000
2
Beds
1
Bath
1,280
Sq Ft
$127/Sq Ft
Est. Value
About This Home
This home is located at 167 Lower Big Springs Rd, Lagrange, GA 30241 and is currently estimated at $162,658, approximately $127 per square foot. 167 Lower Big Springs Rd is a home located in Troup County with nearby schools including Whitesville Road Elementary School, Rosemont Elementary School, and Berta Weathersbee Elementary School.
Ownership History
Date
Name
Owned For
Owner Type
Purchase Details
Closed on
Apr 29, 2005
Sold by
Federal National Mortgage Association
Bought by
Sims Roger D and Sims Kathryn
Current Estimated Value
Home Financials for this Owner
Home Financials are based on the most recent Mortgage that was taken out on this home.
Original Mortgage
$58,088
Outstanding Balance
$30,559
Interest Rate
5.98%
Mortgage Type
FHA
Estimated Equity
$132,099
Purchase Details
Closed on
Sep 8, 2004
Sold by
Chase Manhattan Mortgage
Bought by
Federal National Mortgage
Purchase Details
Closed on
Sep 7, 2004
Sold by
Arrington Kendra
Bought by
Chase Manhattan Mortgage
Purchase Details
Closed on
Oct 5, 2000
Sold by
Bailey Delores
Bought by
Arrington Kendra
Purchase Details
Closed on
Aug 22, 2000
Sold by
Zachery Bailey and Zachery In Divorce
Bought by
Bailey Delores
Purchase Details
Closed on
Apr 1, 1995
Sold by
Johnny Dewayne Bailey
Bought by
Zachery Bailey and Zachery In Divorce
Purchase Details
Closed on
Sep 22, 1992
Sold by
Bailey S
Bought by
Johnny Dewayne Bailey
Purchase Details
Closed on
Mar 5, 1984
Bought by
Bailey S
Create a Home Valuation Report for This Property
The Home Valuation Report is an in-depth analysis detailing your home's value as well as a comparison with similar homes in the area
Home Values in the Area
Average Home Value in this Area
Purchase History
| Date | Buyer | Sale Price | Title Company |
|---|---|---|---|
| Sims Roger D | $59,000 | -- | |
| Federal National Mortgage | $74,900 | -- | |
| Chase Manhattan Mortgage | $74,900 | -- | |
| Arrington Kendra | $25,000 | -- | |
| Bailey Delores | -- | -- | |
| Zachery Bailey | $10,000 | -- | |
| Johnny Dewayne Bailey | -- | -- | |
| Bailey S | -- | -- |
Source: Public Records
Mortgage History
| Date | Status | Borrower | Loan Amount |
|---|---|---|---|
| Open | Sims Roger D | $58,088 |
Source: Public Records
Tax History Compared to Growth
Tax History
| Year | Tax Paid | Tax Assessment Tax Assessment Total Assessment is a certain percentage of the fair market value that is determined by local assessors to be the total taxable value of land and additions on the property. | Land | Improvement |
|---|---|---|---|---|
| 2024 | $1,241 | $47,508 | $12,480 | $35,028 |
| 2023 | $968 | $37,476 | $12,480 | $24,996 |
| 2022 | $949 | $35,996 | $12,480 | $23,516 |
| 2021 | $891 | $31,528 | $10,360 | $21,168 |
| 2020 | $891 | $31,528 | $10,360 | $21,168 |
| 2019 | $886 | $31,356 | $10,360 | $20,996 |
| 2018 | $828 | $29,428 | $10,360 | $19,068 |
| 2017 | $828 | $29,428 | $10,360 | $19,068 |
| 2016 | $585 | $21,366 | $3,600 | $17,766 |
| 2015 | $586 | $21,366 | $3,600 | $17,766 |
| 2014 | $551 | $20,193 | $3,600 | $16,593 |
| 2013 | -- | $22,500 | $3,600 | $18,900 |
Source: Public Records
Map
Nearby Homes
- 250 Wilcox Rd
- 2851 & 2891 Hamilton Rd
- 111 Hamilton Lake View Ct
- 138 Hamilton Lake Dr
- 130 Hamilton Lake Dr
- 670 Lower Big Springs Rd
- 401 Lower Big Springs Rd Unit LOT 1
- 137 Robertson Rd
- 3691 Hamilton Rd
- 553 Lago Ct
- 517 Lago Ct
- 557 Lago Ct
- 501 Lago Ct
- 37 Lake Dr
- 119 Robertson Rd
- 11.59+/- AC Hunt Rd
- 379 Linman Dr
- 329 Linman Dr
- 660 Bartley Rd
- 3919 Hamilton Rd Unit LOT 1
- 155 Lower Big Springs Rd
- 179 Lower Big Springs Rd
- 176 Lower Big Springs Rd
- 195 Lower Big Springs Rd
- 142 Lower Big Springs Rd
- 131 Lower Big Springs Rd
- 215 Lower Big Springs Rd
- 124 Lower Big Springs Rd
- 138 Lower Big Springs Rd
- 212 Lower Big Springs Rd
- 115 Lower Big Springs Rd
- 0 Drake Rd Unit 7573157
- 223 Lower Big Springs Rd
- 222 Lower Big Springs Rd
- 39 Drake Rd
- 136 Lower Big Springs Rd
- 104 Lower Big Springs Rd
- 99 Lower Big Springs Rd
- 96 Lower Big Springs Rd
- 53 Drake Rd