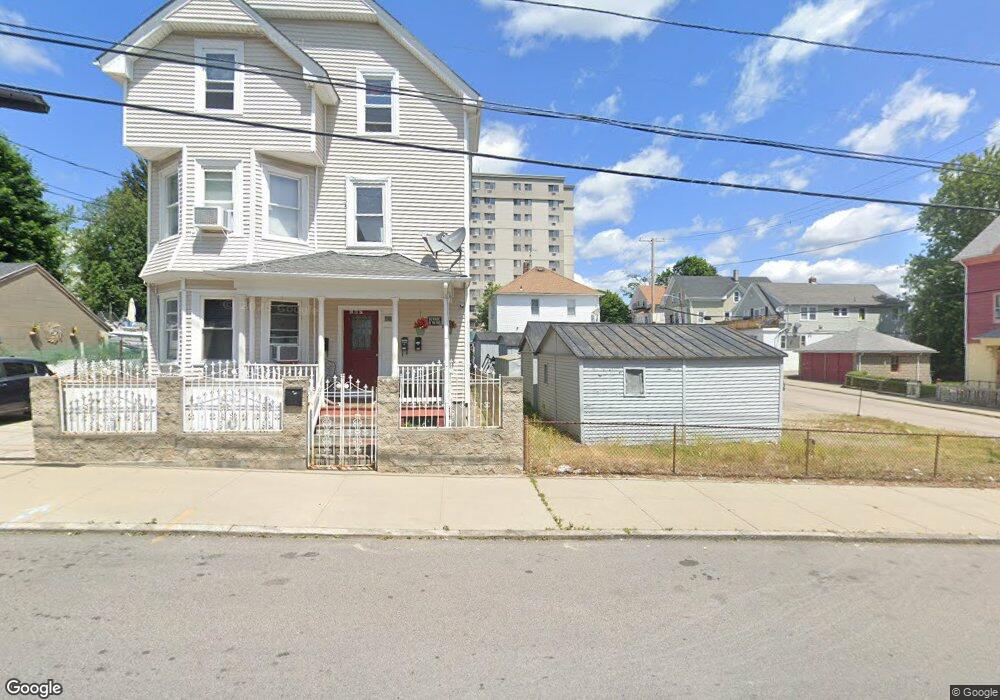
167 Magnolia St Providence, RI 02909
Silver Lake NeighborhoodEstimated Value: $440,031 - $644,000
9
Beds
3
Baths
2,822
Sq Ft
$206/Sq Ft
Est. Value
About This Home
This home is located at 167 Magnolia St, Providence, RI 02909 and is currently estimated at $581,758, approximately $206 per square foot. 167 Magnolia St is a home located in Providence County with nearby schools including Charles N. Fortes Elementary School, Asa Messer Elementary School, and Laurel Hill Annex School.
Ownership History
Date
Name
Owned For
Owner Type
Purchase Details
Closed on
Oct 4, 2010
Sold by
Arion Constr
Bought by
Torres-Garcia Bienvenido and Moronta Minolka
Current Estimated Value
Home Financials for this Owner
Home Financials are based on the most recent Mortgage that was taken out on this home.
Original Mortgage
$176,621
Outstanding Balance
$116,628
Interest Rate
4.44%
Mortgage Type
Purchase Money Mortgage
Estimated Equity
$465,130
Purchase Details
Closed on
Nov 16, 2009
Sold by
Department Of Housing & Urban Dev
Bought by
Arion Constr Llc
Purchase Details
Closed on
Jan 17, 2008
Sold by
Everhome Mortgage Co
Bought by
Morales Jose A
Purchase Details
Closed on
Jun 15, 2001
Sold by
Lang Kevin J and Lang Corinne A
Bought by
Demello Stephanie J and Morales Jose A
Purchase Details
Closed on
Jan 14, 1998
Sold by
Guadiana Frank A and Guadiana Jane
Bought by
Lang Kevin J and Lang Corinne
Create a Home Valuation Report for This Property
The Home Valuation Report is an in-depth analysis detailing your home's value as well as a comparison with similar homes in the area
Home Values in the Area
Average Home Value in this Area
Purchase History
| Date | Buyer | Sale Price | Title Company |
|---|---|---|---|
| Torres-Garcia Bienvenido | $179,000 | -- | |
| Arion Constr Llc | $58,000 | -- | |
| Morales Jose A | $255,819 | -- | |
| Demello Stephanie J | $122,000 | -- | |
| Lang Kevin J | $70,000 | -- |
Source: Public Records
Mortgage History
| Date | Status | Borrower | Loan Amount |
|---|---|---|---|
| Open | Lang Kevin J | $176,621 | |
| Closed | Lang Kevin J | $2,500 |
Source: Public Records
Tax History Compared to Growth
Tax History
| Year | Tax Paid | Tax Assessment Tax Assessment Total Assessment is a certain percentage of the fair market value that is determined by local assessors to be the total taxable value of land and additions on the property. | Land | Improvement |
|---|---|---|---|---|
| 2025 | $4,146 | $549,100 | $129,600 | $419,500 |
| 2024 | $6,575 | $358,300 | $72,900 | $285,400 |
| 2023 | $6,575 | $358,300 | $72,900 | $285,400 |
| 2022 | $6,378 | $358,300 | $72,900 | $285,400 |
| 2021 | $5,894 | $240,000 | $48,300 | $191,700 |
| 2020 | $5,894 | $240,000 | $48,300 | $191,700 |
| 2019 | $5,752 | $234,200 | $48,300 | $185,900 |
| 2018 | $4,839 | $151,400 | $46,800 | $104,600 |
| 2017 | $4,839 | $151,400 | $46,800 | $104,600 |
| 2016 | $4,839 | $151,400 | $46,800 | $104,600 |
| 2015 | $4,561 | $137,800 | $49,700 | $88,100 |
| 2014 | $4,651 | $137,800 | $49,700 | $88,100 |
| 2013 | $4,651 | $137,800 | $49,700 | $88,100 |
Source: Public Records
Map
Nearby Homes