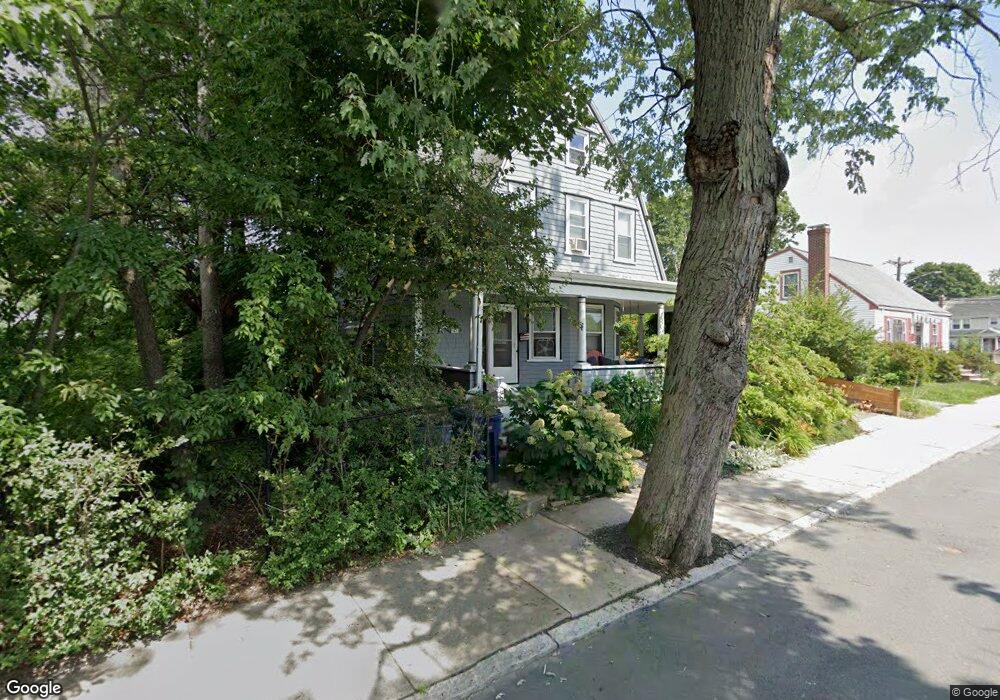
167 Maple St West Roxbury, MA 02132
West Roxbury NeighborhoodEstimated Value: $1,042,000 - $1,299,000
4
Beds
3
Baths
2,700
Sq Ft
$432/Sq Ft
Est. Value
About This Home
This home is located at 167 Maple St, West Roxbury, MA 02132 and is currently estimated at $1,165,102, approximately $431 per square foot. 167 Maple St is a home located in Suffolk County with nearby schools including Holy Name Parish School, St Theresa School, and The Roxbury Latin School.
Ownership History
Date
Name
Owned For
Owner Type
Purchase Details
Closed on
Jul 31, 2002
Sold by
Simon Larry and Gulla Katherine E
Bought by
Tedesco Vanessa M and Tedesco Robert P
Current Estimated Value
Home Financials for this Owner
Home Financials are based on the most recent Mortgage that was taken out on this home.
Original Mortgage
$170,000
Interest Rate
6.64%
Mortgage Type
Purchase Money Mortgage
Create a Home Valuation Report for This Property
The Home Valuation Report is an in-depth analysis detailing your home's value as well as a comparison with similar homes in the area
Home Values in the Area
Average Home Value in this Area
Purchase History
| Date | Buyer | Sale Price | Title Company |
|---|---|---|---|
| Tedesco Vanessa M | $600,000 | -- |
Source: Public Records
Mortgage History
| Date | Status | Borrower | Loan Amount |
|---|---|---|---|
| Open | Tedesco Vanessa M | $152,000 | |
| Closed | Tedesco Vanessa M | $170,000 |
Source: Public Records
Tax History
| Year | Tax Paid | Tax Assessment Tax Assessment Total Assessment is a certain percentage of the fair market value that is determined by local assessors to be the total taxable value of land and additions on the property. | Land | Improvement |
|---|---|---|---|---|
| 2025 | $11,637 | $1,004,900 | $326,300 | $678,600 |
| 2024 | $10,462 | $959,800 | $275,500 | $684,300 |
| 2023 | $9,722 | $905,200 | $259,800 | $645,400 |
| 2022 | $8,953 | $822,900 | $236,200 | $586,700 |
| 2021 | $8,245 | $772,700 | $227,100 | $545,600 |
| 2020 | $7,721 | $731,200 | $183,100 | $548,100 |
| 2019 | $7,191 | $682,300 | $169,800 | $512,500 |
| 2018 | $6,877 | $656,200 | $169,800 | $486,400 |
| 2017 | $6,878 | $649,500 | $169,800 | $479,700 |
| 2016 | $6,677 | $607,000 | $169,800 | $437,200 |
| 2015 | $6,619 | $546,600 | $178,900 | $367,700 |
| 2014 | $6,486 | $515,600 | $178,900 | $336,700 |
Source: Public Records
Map
Nearby Homes
- 104 Greaton Rd
- 72 Redlands Rd
- 72-74 Manthorne Rd Unit 74
- 55 Redlands Rd
- 37 Hastings St Unit 201
- 37 Hastings St Unit 103
- 96 Theodore Parker Rd
- 32 Russett Rd
- 170 Bonad Rd
- 23 Atlantis St
- 227 Bonad Rd
- 24 Rhoda St
- 100 Anderer Ln Unit 2
- 73 Dent St Unit 2
- 68 Carroll St
- 4 Anawan Ave Unit 7
- 205 Park St Unit 2
- 183 Temple St
- 923 Lagrange St
- 150 Tyndale St Unit 2
Your Personal Tour Guide
Ask me questions while you tour the home.