Estimated Value: $253,087 - $374,000
Studio
--
Bath
700
Sq Ft
$466/Sq Ft
Est. Value
About This Home
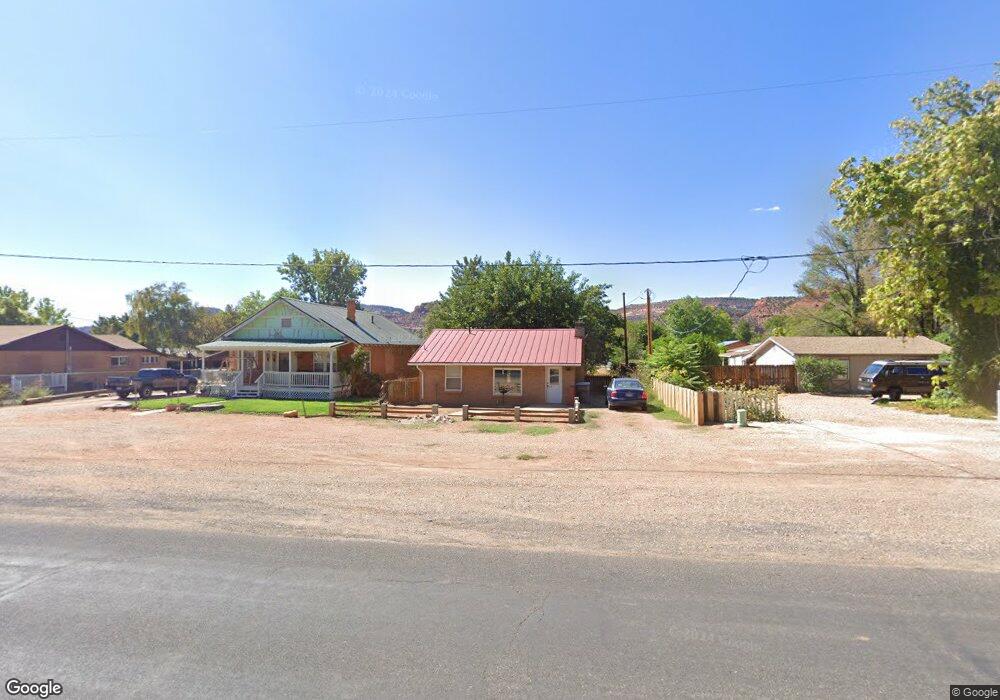
This home is located at 167 N Main St, Kanab, UT 84741 and is currently estimated at $326,522, approximately $466 per square foot. 167 N Main St is a home located in Kane County with nearby schools including Kanab Elementary School, Kanab Middle School, and Kanab High School.
Ownership History
Date
Name
Owned For
Owner Type
Purchase Details
Closed on
Oct 23, 2020
Sold by
Ashton Carol A
Bought by
Reynolds Robert Tracy
Current Estimated Value
Purchase Details
Closed on
Feb 15, 2018
Sold by
Jones J R
Bought by
Reynolds Robert Tracy
Purchase Details
Closed on
Mar 14, 2016
Sold by
Miller Kevin H and Miller Roberta R
Bought by
Knape Madison W and Knape Elizabeth
Purchase Details
Closed on
Aug 29, 2011
Sold by
Voda Ann M and Ann M Voda Living Trust
Bought by
Miller Keven H and Miller Roberta R
Home Financials for this Owner
Home Financials are based on the most recent Mortgage that was taken out on this home.
Original Mortgage
$90,960
Interest Rate
4.43%
Create a Home Valuation Report for This Property
The Home Valuation Report is an in-depth analysis detailing your home's value as well as a comparison with similar homes in the area
Home Values in the Area
Average Home Value in this Area
Purchase History
| Date | Buyer | Sale Price | Title Company |
|---|---|---|---|
| Reynolds Robert Tracy | -- | -- | |
| Reynolds Robert Tracy | -- | -- | |
| Knape Madison W | -- | -- | |
| Miller Keven H | -- | -- |
Source: Public Records
Mortgage History
| Date | Status | Borrower | Loan Amount |
|---|---|---|---|
| Previous Owner | Miller Keven H | $90,960 |
Source: Public Records
Tax History
| Year | Tax Paid | Tax Assessment Tax Assessment Total Assessment is a certain percentage of the fair market value that is determined by local assessors to be the total taxable value of land and additions on the property. | Land | Improvement |
|---|---|---|---|---|
| 2025 | -- | $241,643 | $113,094 | $128,549 |
| 2024 | -- | $128,775 | $51,854 | $76,921 |
| 2023 | $0 | $119,312 | $49,384 | $69,928 |
| 2022 | $861 | $101,559 | $37,988 | $63,571 |
| 2021 | $784 | $138,747 | $53,130 | $85,617 |
| 2020 | $776 | $133,327 | $48,300 | $85,027 |
| 2019 | $820 | $137,144 | $46,860 | $90,284 |
| 2018 | $780 | $129,334 | $39,050 | $90,284 |
| 2017 | $759 | $120,199 | $35,500 | $84,699 |
| 2016 | $668 | $102,734 | $35,500 | $67,234 |
| 2015 | $473 | $96,837 | $35,500 | $61,337 |
| 2014 | $473 | $72,426 | $37,908 | $34,518 |
| 2013 | -- | $39,834 | $0 | $0 |
Source: Public Records
Map
Nearby Homes
Your Personal Tour Guide
Ask me questions while you tour the home.