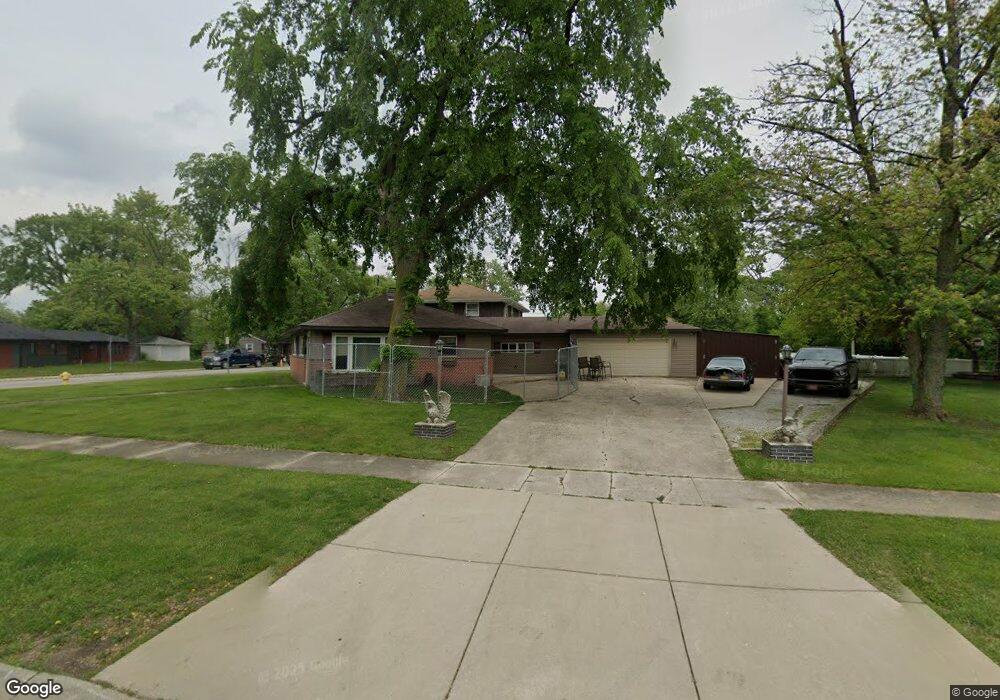
167 Nashua St Park Forest, IL 60466
Estimated Value: $128,000 - $176,000
2
Beds
1
Bath
949
Sq Ft
$155/Sq Ft
Est. Value
About This Home
This home is located at 167 Nashua St, Park Forest, IL 60466 and is currently estimated at $146,957, approximately $154 per square foot. 167 Nashua St is a home located in Cook County with nearby schools including Blackhawk Intermediate Center, 21st Century Primary Center, and Michelle Obama School of Technology.
Ownership History
Date
Name
Owned For
Owner Type
Purchase Details
Closed on
Mar 12, 2016
Sold by
Hansel George
Bought by
Burger Michele M
Current Estimated Value
Purchase Details
Closed on
Sep 21, 2009
Sold by
Deutsche Bank National Trust Company
Bought by
Hansel George
Purchase Details
Closed on
Feb 6, 2009
Sold by
Hardtke Charles C and Hardtke Charles
Bought by
Indymac Bank Fsb
Purchase Details
Closed on
Feb 20, 2005
Sold by
Gannon Michael G
Bought by
Hardtke Charles C
Home Financials for this Owner
Home Financials are based on the most recent Mortgage that was taken out on this home.
Original Mortgage
$99,750
Interest Rate
8.62%
Mortgage Type
Unknown
Purchase Details
Closed on
Feb 19, 2005
Sold by
Gannon Francis E and Gannon Cynthia L
Bought by
Hardtke Charles C
Home Financials for this Owner
Home Financials are based on the most recent Mortgage that was taken out on this home.
Original Mortgage
$99,750
Interest Rate
8.62%
Mortgage Type
Unknown
Create a Home Valuation Report for This Property
The Home Valuation Report is an in-depth analysis detailing your home's value as well as a comparison with similar homes in the area
Home Values in the Area
Average Home Value in this Area
Purchase History
| Date | Buyer | Sale Price | Title Company |
|---|---|---|---|
| Burger Michele M | -- | None Available | |
| Hansel George | $41,000 | Ticor Title Insurance Co | |
| Deutsche Bank National Trust Company | -- | Ticor Title Insurance Co | |
| Indymac Bank Fsb | -- | None Available | |
| Hardtke Charles C | -- | Cti | |
| Hardtke Charles C | $105,000 | Cti |
Source: Public Records
Mortgage History
| Date | Status | Borrower | Loan Amount |
|---|---|---|---|
| Previous Owner | Hardtke Charles C | $99,750 |
Source: Public Records
Tax History Compared to Growth
Tax History
| Year | Tax Paid | Tax Assessment Tax Assessment Total Assessment is a certain percentage of the fair market value that is determined by local assessors to be the total taxable value of land and additions on the property. | Land | Improvement |
|---|---|---|---|---|
| 2024 | $5,139 | $11,000 | $3,738 | $7,262 |
| 2023 | $1,010 | $11,000 | $3,738 | $7,262 |
| 2022 | $1,010 | $4,856 | $3,471 | $1,385 |
| 2021 | $1,133 | $4,855 | $3,470 | $1,385 |
| 2020 | $1,362 | $4,855 | $3,470 | $1,385 |
| 2019 | $2,971 | $6,845 | $3,203 | $3,642 |
| 2018 | $2,856 | $6,845 | $3,203 | $3,642 |
| 2017 | $3,617 | $6,845 | $3,203 | $3,642 |
| 2016 | $5,355 | $7,884 | $2,936 | $4,948 |
| 2015 | $5,111 | $7,884 | $2,936 | $4,948 |
| 2014 | $5,012 | $7,884 | $2,936 | $4,948 |
| 2013 | $4,049 | $7,422 | $2,936 | $4,486 |
Source: Public Records
Map
Nearby Homes
- 140 Nashua St
- 178 Nauvoo St
- 136 Iroquois St
- 212 Nashua St
- 159 Blackhawk Dr
- 201 Miami St
- 277 Somonauk St
- 363 Indianwood Blvd
- 208 Miami St
- 224 Shabbona Dr
- 223 Miami St
- 471 Indianwood Blvd
- 303 Somonauk St
- 480 Shabbona Dr
- 155 Shabbona Dr
- 178 Monee Rd
- 176 Monee Rd
- 304 Somonauk St
- 453 Titonka St
- 357 Neola St
- 165 Nashua St
- 163 Nashua St
- 148 Nashua St
- 161 Nashua St
- 425 Indianwood Blvd
- 192 Nauvoo St
- 146 Nashua St
- 190 Nauvoo St
- 159 Nashua St
- 424 Indianwood Blvd
- 144 Nashua St
- 188 Nauvoo St
- 413 Indianwood Blvd
- 428 Indianwood Blvd
- 420 Indianwood Blvd
- 157 Nashua St
- 186 Nauvoo St
- 142 Nashua St
- 411 Indianwood Blvd
- 202 Nashua St