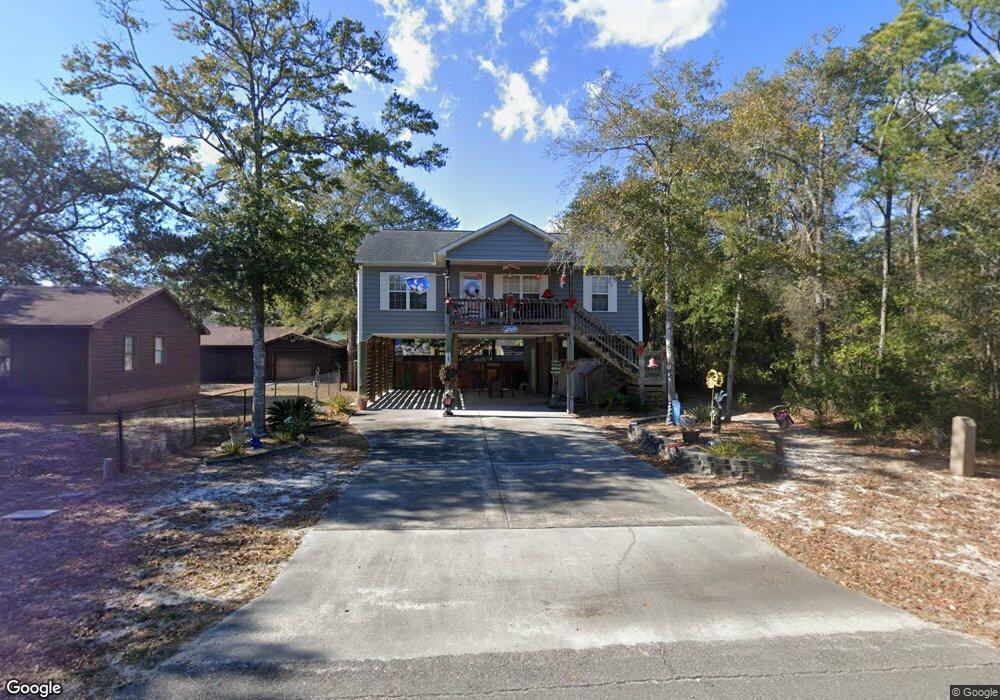
167 NW 9th St Oak Island, NC 28465
Estimated Value: $483,000 - $523,000
3
Beds
2
Baths
1,101
Sq Ft
$458/Sq Ft
Est. Value
About This Home
This home is located at 167 NW 9th St, Oak Island, NC 28465 and is currently estimated at $504,523, approximately $458 per square foot. 167 NW 9th St is a home located in Brunswick County with nearby schools including Southport Elementary School, South Brunswick Middle School, and South Brunswick High School.
Ownership History
Date
Name
Owned For
Owner Type
Purchase Details
Closed on
Jun 1, 2009
Sold by
Keesee Brian Keith and Keesee Kimberly M
Bought by
Not Provided Frances Ann
Current Estimated Value
Purchase Details
Closed on
May 1, 2005
Sold by
Brian Keith Keesee Construction Inc
Bought by
Keesee Brian Keith and Keesee Kimberly M
Home Financials for this Owner
Home Financials are based on the most recent Mortgage that was taken out on this home.
Original Mortgage
$155,000
Interest Rate
5.74%
Mortgage Type
New Conventional
Create a Home Valuation Report for This Property
The Home Valuation Report is an in-depth analysis detailing your home's value as well as a comparison with similar homes in the area
Home Values in the Area
Average Home Value in this Area
Purchase History
| Date | Buyer | Sale Price | Title Company |
|---|---|---|---|
| Not Provided Frances Ann | $209,000 | None Available | |
| Keesee Brian Keith | -- | None Available |
Source: Public Records
Mortgage History
| Date | Status | Borrower | Loan Amount |
|---|---|---|---|
| Previous Owner | Keesee Brian Keith | $155,000 |
Source: Public Records
Tax History Compared to Growth
Tax History
| Year | Tax Paid | Tax Assessment Tax Assessment Total Assessment is a certain percentage of the fair market value that is determined by local assessors to be the total taxable value of land and additions on the property. | Land | Improvement |
|---|---|---|---|---|
| 2025 | $1,944 | $456,540 | $125,000 | $331,540 |
| 2024 | $1,944 | $456,540 | $125,000 | $331,540 |
| 2023 | $1,431 | $456,540 | $125,000 | $331,540 |
| 2022 | $1,431 | $238,310 | $58,000 | $180,310 |
| 2021 | $1,401 | $238,310 | $58,000 | $180,310 |
| 2020 | $1,376 | $238,310 | $58,000 | $180,310 |
| 2019 | $1,376 | $64,060 | $58,000 | $6,060 |
| 2018 | $1,166 | $44,320 | $37,000 | $7,320 |
| 2017 | $1,166 | $44,320 | $37,000 | $7,320 |
| 2016 | $1,141 | $44,320 | $37,000 | $7,320 |
| 2015 | $1,141 | $198,250 | $37,000 | $161,250 |
| 2014 | $950 | $176,183 | $45,000 | $131,183 |
Source: Public Records
Map
Nearby Homes