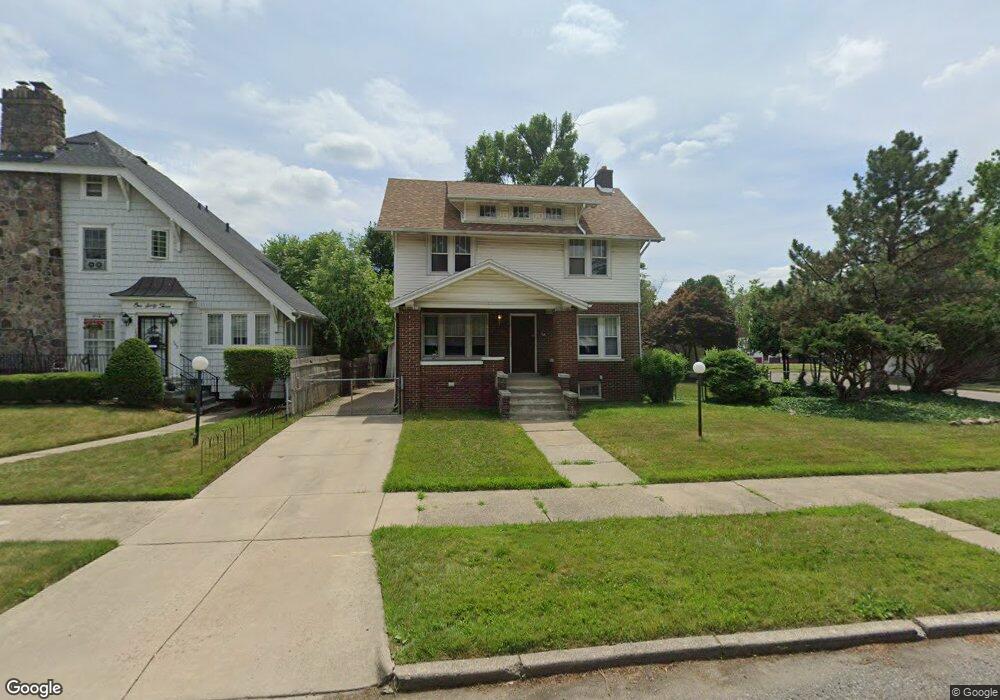
167 Puritan St Unit Bldg-Unit Highland Park, MI 48203
Estimated Value: $94,000 - $243,000
--
Bed
1
Bath
1,756
Sq Ft
$86/Sq Ft
Est. Value
About This Home
This home is located at 167 Puritan St Unit Bldg-Unit, Highland Park, MI 48203 and is currently estimated at $151,096, approximately $86 per square foot. 167 Puritan St Unit Bldg-Unit is a home located in Wayne County with nearby schools including George Washington Carver Elementary School, Sigma Academy for Leadership & Early Middle College, and George Washington Carver Academy - Middle School.
Ownership History
Date
Name
Owned For
Owner Type
Purchase Details
Closed on
Jun 21, 2018
Sold by
Secretary Of H U D
Bought by
Brown Terrente and Brown Rosalie C
Current Estimated Value
Purchase Details
Closed on
Feb 3, 2014
Sold by
Secretary Of Housing & Urban Development
Bought by
Pnc Bank National Association
Purchase Details
Closed on
Oct 1, 2013
Sold by
Pnc Bank National Association
Bought by
The Secretary Of Housing & Urban Develop
Purchase Details
Closed on
Mar 7, 2013
Sold by
Jones Toni K and National City Mortgage Co
Bought by
Pnc Bank National Association
Create a Home Valuation Report for This Property
The Home Valuation Report is an in-depth analysis detailing your home's value as well as a comparison with similar homes in the area
Home Values in the Area
Average Home Value in this Area
Purchase History
| Date | Buyer | Sale Price | Title Company |
|---|---|---|---|
| Brown Terrente | $29,900 | None Available | |
| Pnc Bank National Association | -- | None Available | |
| The Secretary Of Housing & Urban Develop | -- | None Available | |
| Pnc Bank National Association | $127,906 | None Available |
Source: Public Records
Tax History Compared to Growth
Tax History
| Year | Tax Paid | Tax Assessment Tax Assessment Total Assessment is a certain percentage of the fair market value that is determined by local assessors to be the total taxable value of land and additions on the property. | Land | Improvement |
|---|---|---|---|---|
| 2025 | $1,262 | $49,000 | $0 | $0 |
| 2024 | $1,262 | $44,100 | $0 | $0 |
| 2023 | $1,210 | $39,400 | $0 | $0 |
| 2022 | $1,382 | $30,500 | $0 | $0 |
| 2021 | $1,355 | $20,800 | $0 | $0 |
| 2019 | $1,418 | $14,600 | $0 | $0 |
| 2018 | $1,010 | $12,000 | $0 | $0 |
| 2017 | $376 | $12,000 | $0 | $0 |
| 2016 | $1,558 | $14,300 | $0 | $0 |
| 2015 | $1,760 | $17,600 | $0 | $0 |
| 2013 | $2,510 | $25,100 | $0 | $0 |
| 2012 | $2,281 | $27,200 | $5,000 | $22,200 |
Source: Public Records
Map
Nearby Homes