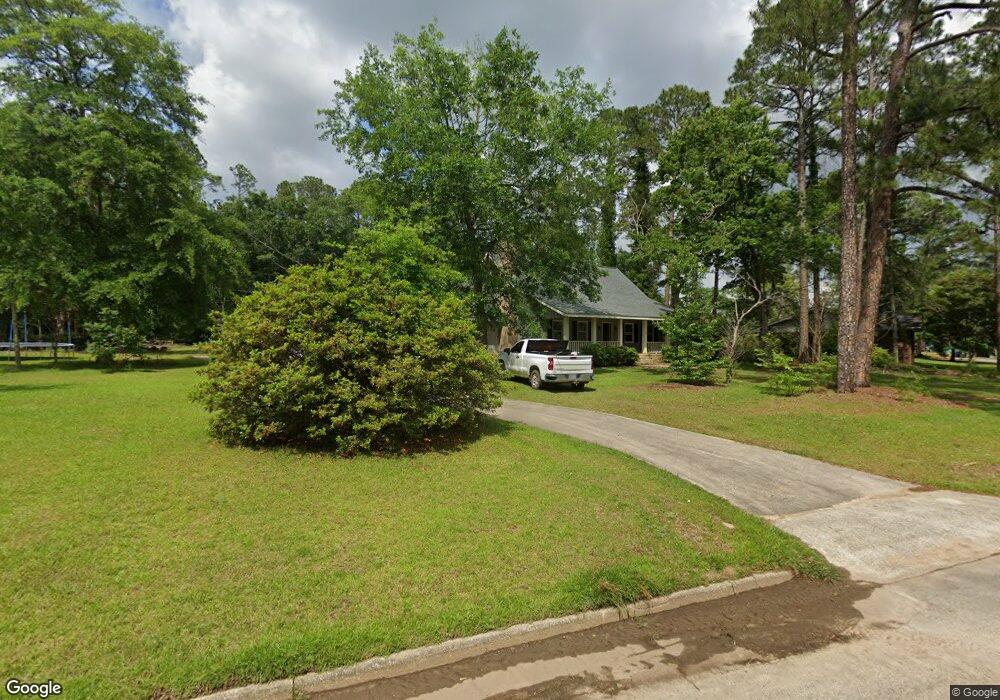
167 Shenandoah Dr Fitzgerald, GA 31750
Estimated Value: $261,765 - $318,000
4
Beds
3
Baths
2,634
Sq Ft
$110/Sq Ft
Est. Value
About This Home
This home is located at 167 Shenandoah Dr, Fitzgerald, GA 31750 and is currently estimated at $290,941, approximately $110 per square foot. 167 Shenandoah Dr is a home located in Ben Hill County with nearby schools including Ben Hill County Primary School, Ben Hill Elementary School, and Ben Hill County Middle School.
Ownership History
Date
Name
Owned For
Owner Type
Purchase Details
Closed on
Dec 9, 2019
Sold by
Oliver William P
Bought by
Robitzsch Kimberleigh Morris
Current Estimated Value
Home Financials for this Owner
Home Financials are based on the most recent Mortgage that was taken out on this home.
Original Mortgage
$170,062
Outstanding Balance
$152,195
Interest Rate
4.4%
Mortgage Type
FHA
Estimated Equity
$138,746
Purchase Details
Closed on
Jul 22, 2013
Sold by
Griffin V Michael
Bought by
Oliver William P and Oliver Cherilyn W
Home Financials for this Owner
Home Financials are based on the most recent Mortgage that was taken out on this home.
Original Mortgage
$127,200
Interest Rate
3.96%
Mortgage Type
New Conventional
Purchase Details
Closed on
Aug 5, 1988
Bought by
Griffin Michael J
Create a Home Valuation Report for This Property
The Home Valuation Report is an in-depth analysis detailing your home's value as well as a comparison with similar homes in the area
Home Values in the Area
Average Home Value in this Area
Purchase History
| Date | Buyer | Sale Price | Title Company |
|---|---|---|---|
| Robitzsch Kimberleigh Morris | $173,200 | -- | |
| Oliver William P | $159,000 | -- | |
| Griffin Michael J | $105,000 | -- |
Source: Public Records
Mortgage History
| Date | Status | Borrower | Loan Amount |
|---|---|---|---|
| Open | Robitzsch Kimberleigh Morris | $170,062 | |
| Previous Owner | Oliver William P | $127,200 |
Source: Public Records
Tax History Compared to Growth
Tax History
| Year | Tax Paid | Tax Assessment Tax Assessment Total Assessment is a certain percentage of the fair market value that is determined by local assessors to be the total taxable value of land and additions on the property. | Land | Improvement |
|---|---|---|---|---|
| 2024 | $3,633 | $85,157 | $4,000 | $81,157 |
| 2023 | $2,485 | $81,029 | $4,000 | $77,029 |
| 2022 | $2,322 | $70,213 | $4,000 | $66,213 |
| 2021 | $2,274 | $66,173 | $4,000 | $62,173 |
| 2020 | $2,268 | $65,247 | $4,000 | $61,247 |
| 2019 | $1,827 | $58,776 | $4,000 | $54,776 |
| 2018 | $2,516 | $58,389 | $4,000 | $54,389 |
| 2017 | $1,801 | $57,770 | $4,000 | $53,770 |
| 2016 | $1,654 | $55,758 | $4,000 | $51,758 |
| 2015 | -- | $55,758 | $4,000 | $51,758 |
| 2014 | -- | $54,798 | $4,000 | $50,798 |
Source: Public Records
Map
Nearby Homes
- 107 Manassas Place
- 105 Halsey St
- 0 Lincoln Ave
- 200 Irwinville Hwy
- 204 Irwinville Hwy
- 249 Lincoln Ave
- 118 Irwinville Hwy
- 113 S Merrimac Dr
- 137 Atlantic Ave
- 102 Irwinville Hwy
- 809 W Pine St
- 271 Lincoln Ave
- 816 W Central Ave
- 277 Lincoln Ave
- 602 W Jessamine St
- 710 W Central Ave
- 138 Azalea Ln
- 615 W Pine St
- 146 Franklin Ave
- 516 W Magnolia St
- 163 Shenandoah Dr
- 127 Manassas Place
- 179 Shenandoah Dr
- 157 Shenandoah Dr
- 121 Manassas Place
- 0 Manassas Place
- 178 Lynn Dr
- 106 Kennesaw Ct
- 107 Kennesaw Ct
- 124 Manassas Place
- 104 Manassas Ct
- 122 Manassas Place
- 166 Lincoln Ave
- 184 Lynn Dr
- 116 Manassas Place
- 151 Shenandoah Dr
- 179 Lynn Dr
- 147 Shenandoah Dr
- 146 Shenandoah Dr
- 110 Manassas Place