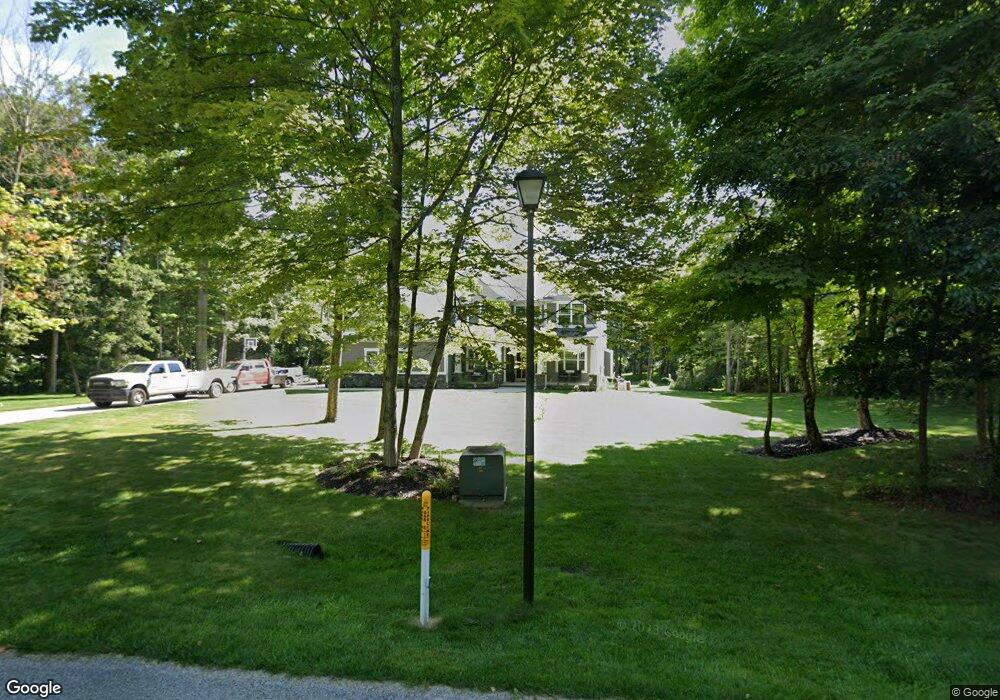
167 Taylor Way Dr Hebron, OH 43025
Union NeighborhoodEstimated Value: $614,000 - $836,000
3
Beds
3
Baths
2,909
Sq Ft
$238/Sq Ft
Est. Value
About This Home
This home is located at 167 Taylor Way Dr, Hebron, OH 43025 and is currently estimated at $693,659, approximately $238 per square foot. 167 Taylor Way Dr is a home located in Licking County with nearby schools including Jackson Intermediate School, Lakewood Middle School, and Lakewood High School.
Ownership History
Date
Name
Owned For
Owner Type
Purchase Details
Closed on
Aug 31, 2017
Sold by
Hunt Gordon and Hunt Lisa A
Bought by
Estock Steve and Estock Stephanie
Current Estimated Value
Purchase Details
Closed on
Aug 28, 2015
Sold by
Lash Karen
Bought by
Hunt Gordon and Hunt Lisa
Purchase Details
Closed on
Jun 28, 2007
Sold by
Lash Robert and Lash Karen
Bought by
Lash Karen
Purchase Details
Closed on
Apr 7, 2006
Sold by
Johnson Jeremy and Johnson Cara
Bought by
Lash Robert and Lash Karen
Purchase Details
Closed on
Aug 26, 2002
Sold by
Tackett Dev Co Ltd
Bought by
Johnson Jeremy and Johnson Cara
Home Financials for this Owner
Home Financials are based on the most recent Mortgage that was taken out on this home.
Original Mortgage
$56,100
Interest Rate
6.75%
Mortgage Type
New Conventional
Create a Home Valuation Report for This Property
The Home Valuation Report is an in-depth analysis detailing your home's value as well as a comparison with similar homes in the area
Home Values in the Area
Average Home Value in this Area
Purchase History
We collect this data history from publicly available records. To have your information removed, we recommend requesting removal directly through your county’s website.
| Date | Buyer | Sale Price | Title Company |
|---|---|---|---|
| Estock Steve | $80,000 | None Available | |
| Hunt Gordon | $105,000 | Attorney | |
| Lash Karen | -- | Attorney | |
| Lash Robert | $79,500 | Crown Se | |
| Johnson Jeremy | $66,000 | -- |
Source: Public Records
Mortgage History
We collect this data history from publicly available records. To have your information removed, we recommend requesting removal directly through your county’s website.
| Date | Status | Borrower | Loan Amount |
|---|---|---|---|
| Previous Owner | Johnson Jeremy | $56,100 |
Source: Public Records
Tax History
| Year | Tax Paid | Tax Assessment Tax Assessment Total Assessment is a certain percentage of the fair market value that is determined by local assessors to be the total taxable value of land and additions on the property. | Land | Improvement |
|---|---|---|---|---|
| 2025 | $7,025 | $171,960 | $41,650 | $130,310 |
| 2024 | $6,818 | $171,960 | $41,650 | $130,310 |
| 2023 | $6,711 | $168,740 | $41,650 | $127,090 |
| 2022 | $4,876 | $116,000 | $32,940 | $83,060 |
| 2021 | $5,034 | $116,000 | $32,940 | $83,060 |
| 2020 | $5,218 | $116,000 | $32,940 | $83,060 |
| 2019 | $4,923 | $102,940 | $27,440 | $75,500 |
| 2018 | $1,221 | $0 | $0 | $0 |
| 2017 | $1,217 | $0 | $0 | $0 |
| 2016 | $1,378 | $0 | $0 | $0 |
| 2015 | $1,370 | $0 | $0 | $0 |
| 2014 | $685 | $0 | $0 | $0 |
| 2013 | $688 | $0 | $0 | $0 |
Source: Public Records
Map
Nearby Homes
- 265 Waters Edge
- 2180 Blacks Rd SW
- 164 Canyon Villa Dr
- 4420 Hickory Ln
- 104 Grand Pointe Dr
- 9257 Lancaster Rd
- 780 National Rd SE
- 3787 Refugee Rd SW
- 112 Williamson Rd SW
- 104 Cumberland Meadows Cir
- 110 Cumberland Meadows Cir
- 202 Cumberland Meadows Cir
- 206 Cumberland Meadows Cir
- 802 Cumberland Meadows Cir
- 814 W Main St
- 0 Hayes Rd Unit Lot 1
- 0 Hayes Rd Unit Lot 2
- 3343 Hayes Rd
- 3224 Hebron Rd
- 113 Blackstone Ct
- 167 Taylor Way Dr
- 0 Taylor Way Dr SW Unit LOT48 2019829
- 100 Taylor Way Dr SW
- 0 Taylor Way Dr SW Unit L-38
- 0 Taylor Way Dr SW Unit L-39
- 151 Taylor Way Dr
- 164 Taylor Way Dr
- 180 Taylor Way Dr SW
- 180 Taylor Way Dr
- 183 Taylor Way Dr
- 148 Taylor Way Dr
- 115 Taylor Way Dr SW
- 115 Taylor Way Dr
- 196 Taylor Way Dr
- 196 Taylor Way Dr SW
- 132 Taylor Way Dr
- 201 Taylor Way Dr
- 212 Taylor Way Dr
- 116 Taylor Way Dr
- 116 Taylor Way Dr SW
Your Personal Tour Guide
Ask me questions while you tour the home.