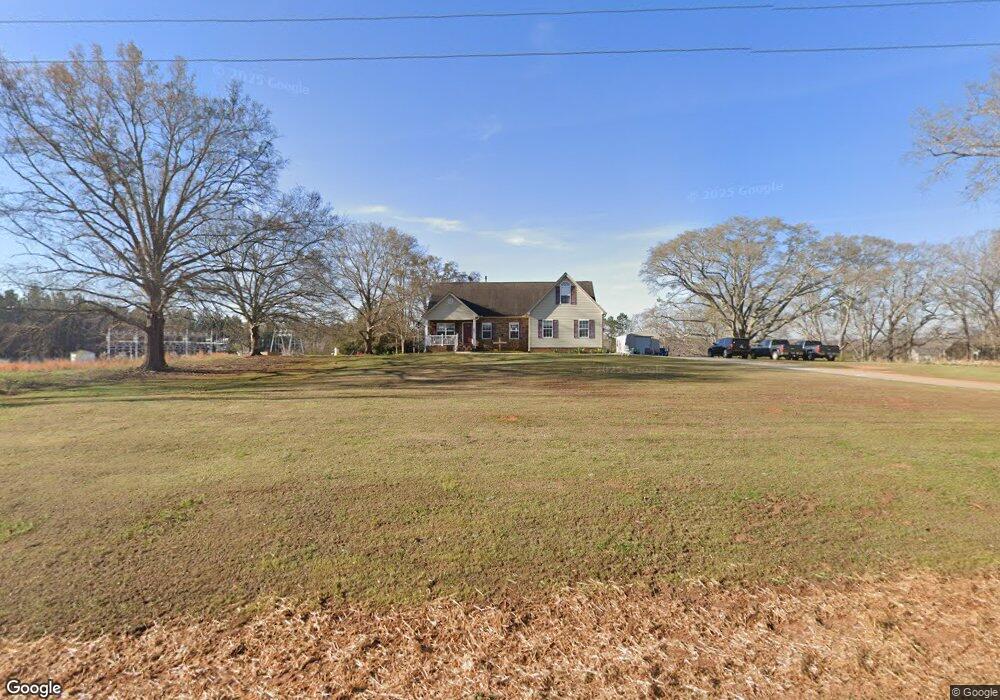
167 Traynham Rd Honea Path, SC 29654
Woodville NeighborhoodEstimated Value: $354,000 - $542,000
3
Beds
2
Baths
1,663
Sq Ft
$264/Sq Ft
Est. Value
About This Home
This home is located at 167 Traynham Rd, Honea Path, SC 29654 and is currently estimated at $439,488, approximately $264 per square foot. 167 Traynham Rd is a home located in Greenville County with nearby schools including Fork Shoals School, Ralph Chandler Middle, and Woodmont High School.
Ownership History
Date
Name
Owned For
Owner Type
Purchase Details
Closed on
Mar 26, 2020
Sold by
Haught Thomas
Bought by
Haught Thomas
Current Estimated Value
Purchase Details
Closed on
Mar 16, 2020
Sold by
Haught Thomas
Bought by
Haught Thomas
Purchase Details
Closed on
Jan 23, 2019
Sold by
Thompson Brian L and Crowder Callie Christine
Bought by
Thompson Brian Leon and Thompson Callie Christine Crowder
Purchase Details
Closed on
Feb 12, 2016
Sold by
Jones Carl L and Jones Susan M
Bought by
Thompson Brian L and Crowder Callie Christine
Home Financials for this Owner
Home Financials are based on the most recent Mortgage that was taken out on this home.
Original Mortgage
$155,471
Outstanding Balance
$122,489
Interest Rate
3.92%
Mortgage Type
New Conventional
Estimated Equity
$316,999
Purchase Details
Closed on
Jul 5, 2011
Sold by
Jones R Lawrence and Jones Janet M
Bought by
Jones R Lawrence and Jones Janet M
Purchase Details
Closed on
Aug 31, 2007
Sold by
Jones Carl L and Jones Susan M
Bought by
Jones R Lawrence and Jones Janet M
Create a Home Valuation Report for This Property
The Home Valuation Report is an in-depth analysis detailing your home's value as well as a comparison with similar homes in the area
Home Values in the Area
Average Home Value in this Area
Purchase History
| Date | Buyer | Sale Price | Title Company |
|---|---|---|---|
| Haught Thomas | -- | None Available | |
| Haught Thomas | -- | None Available | |
| Thompson Brian Leon | -- | None Available | |
| Thompson Brian L | $188,450 | None Available | |
| Jones R Lawrence | -- | -- | |
| Jones R Lawrence | $4,000 | None Available |
Source: Public Records
Mortgage History
| Date | Status | Borrower | Loan Amount |
|---|---|---|---|
| Open | Thompson Brian L | $155,471 |
Source: Public Records
Tax History
| Year | Tax Paid | Tax Assessment Tax Assessment Total Assessment is a certain percentage of the fair market value that is determined by local assessors to be the total taxable value of land and additions on the property. | Land | Improvement |
|---|---|---|---|---|
| 2025 | $1,376 | $9,300 | $1,850 | $7,450 |
| 2024 | $1,376 | $8,090 | $1,680 | $6,410 |
| 2023 | $1,289 | $8,090 | $1,680 | $6,410 |
| 2022 | $1,208 | $8,090 | $1,680 | $6,410 |
| 2021 | $1,208 | $8,090 | $1,680 | $6,410 |
| 2020 | $1,201 | $7,650 | $1,580 | $6,070 |
| 2019 | $1,201 | $7,650 | $1,580 | $6,070 |
| 2018 | $1,198 | $7,650 | $1,580 | $6,070 |
| 2017 | $1,122 | $7,360 | $440 | $6,920 |
| 2016 | $891 | $152,040 | $8,800 | $143,240 |
| 2015 | $606 | $152,040 | $8,800 | $143,240 |
| 2014 | $588 | $149,490 | $8,800 | $140,690 |
Source: Public Records
Map
Nearby Homes
- 846 Latimer Mill Rd
- 00 Traynham Rd
- 310 Penson Rd
- 86 Latimer Ridge Rd
- Lot 1 76 Hwy
- Lot 1,2,3 76 Hwy
- U S 76
- Gin Mill Rd
- 247 Stallion Dr
- Lot 4,5,6 76 Hwy
- Lot 4,5,6 Gin Mill Rd
- Lot 6 Gin Mill Rd
- 17419 Highway 76 W
- 24 Gin Mill Rd
- 469 Boyce Page Rd
- 343 French Rd
- 2075 Cowens Bridge Rd
- 00 French Rd
- 00 Cowens Bridge Rd
- 0 Cowens Bridge Rd
- 168 Traynham Rd
- 189 Traynham Rd
- 175 Traynham Rd
- 112 Flatrock Rd
- 199 Traynham Rd
- 104 Traynham Rd
- 119 Flatrock Rd
- 210 Traynham Rd
- 0 Latimer Mill Rd Unit 1268180
- 0 Latimer Mill Rd Unit 1180364
- 0 Latimer Mill Rd Unit 1156539
- 0 Latimer Mill Rd Unit 1339976
- 0 Latimer Mill Rd Unit Tract a 1352643
- 0 Latimer Mill Rd Unit 1303142
- 0 Latimer Mill Rd Unit Tract B 1344952
- 335 Latimer Mill Rd
- 749 Latimer Mill Rd Unit Tract 1
- 751 Latimer Mill Rd
- 27196 Latimer Mill Rd
- 190 Ross Rd
Your Personal Tour Guide
Ask me questions while you tour the home.