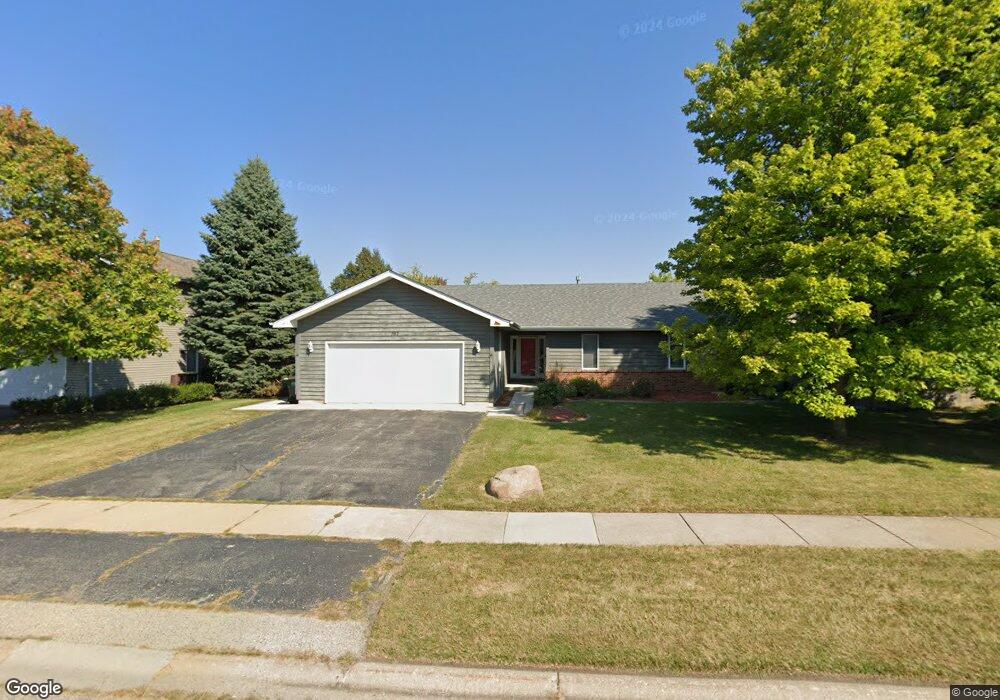
167 Tree Line Antioch, IL 60002
Estimated Value: $322,000 - $355,000
3
Beds
2
Baths
1,647
Sq Ft
$203/Sq Ft
Est. Value
About This Home
This home is located at 167 Tree Line, Antioch, IL 60002 and is currently estimated at $334,635, approximately $203 per square foot. 167 Tree Line is a home located in Lake County with nearby schools including Antioch Community High School.
Ownership History
Date
Name
Owned For
Owner Type
Purchase Details
Closed on
Dec 28, 2017
Sold by
Batchelder James E and Batchelder Kary M
Bought by
James E Batchelder Revocable Trust and Kary M Batchelder Revocable Trust
Current Estimated Value
Purchase Details
Closed on
Jul 17, 2017
Sold by
Corcoran Stacy S
Bought by
Batchelder James E and Batchelder Kary M
Home Financials for this Owner
Home Financials are based on the most recent Mortgage that was taken out on this home.
Original Mortgage
$175,000
Outstanding Balance
$145,355
Interest Rate
3.88%
Mortgage Type
Seller Take Back
Estimated Equity
$189,280
Purchase Details
Closed on
Dec 8, 2006
Sold by
Corcoran Patrick T and Corcoran Stacy S
Bought by
Corcoran Stacy S
Purchase Details
Closed on
Apr 24, 2001
Sold by
Wierzchowiecki Jacek M and Wierzchowiecki Marzenna L
Bought by
Corcoran Patrick and Corcoran Stacy
Home Financials for this Owner
Home Financials are based on the most recent Mortgage that was taken out on this home.
Original Mortgage
$165,560
Interest Rate
6.95%
Mortgage Type
FHA
Create a Home Valuation Report for This Property
The Home Valuation Report is an in-depth analysis detailing your home's value as well as a comparison with similar homes in the area
Home Values in the Area
Average Home Value in this Area
Purchase History
| Date | Buyer | Sale Price | Title Company |
|---|---|---|---|
| James E Batchelder Revocable Trust | -- | Attorney | |
| Batchelder James E | $175,000 | First American Title Insuran | |
| Corcoran Stacy S | -- | None Available | |
| Corcoran Patrick | $168,000 | -- |
Source: Public Records
Mortgage History
| Date | Status | Borrower | Loan Amount |
|---|---|---|---|
| Open | Batchelder James E | $175,000 | |
| Previous Owner | Corcoran Patrick | $165,560 |
Source: Public Records
Tax History Compared to Growth
Tax History
| Year | Tax Paid | Tax Assessment Tax Assessment Total Assessment is a certain percentage of the fair market value that is determined by local assessors to be the total taxable value of land and additions on the property. | Land | Improvement |
|---|---|---|---|---|
| 2024 | $8,041 | $81,290 | $10,979 | $70,311 |
| 2023 | $7,977 | $81,056 | $9,831 | $71,225 |
| 2022 | $7,977 | $77,023 | $11,922 | $65,101 |
| 2021 | $7,388 | $71,870 | $11,124 | $60,746 |
| 2020 | $7,233 | $69,885 | $10,817 | $59,068 |
| 2019 | $7,332 | $66,831 | $10,344 | $56,487 |
| 2018 | $7,064 | $65,788 | $13,031 | $52,757 |
| 2017 | $6,995 | $62,619 | $12,403 | $50,216 |
| 2016 | $6,815 | $60,432 | $11,970 | $48,462 |
| 2015 | $6,652 | $58,895 | $11,666 | $47,229 |
| 2014 | $5,924 | $57,028 | $17,826 | $39,202 |
| 2012 | $5,482 | $57,028 | $17,826 | $39,202 |
Source: Public Records
Map
Nearby Homes
- 602 Anita Ave
- 672 Garys Dr
- 770 Anita Ave
- 56 Burnette Dr
- 68 Burnette Dr
- 52 Burnette Dr
- 45 Van Dyke Dr
- 460 Maplewood Dr
- 44 Burnette Dr
- 49 Burnette Dr
- 36 Burnette Dr
- 152 E Depot St
- 394 Birchwood Dr
- 324 Elmwood Ln
- 801 Main St
- 0 Anita Ave Unit MRD12354735
- 188 Oakwood Dr
- 198 Bridgewood Dr
- 582 Phillips Cir
- 197 E Old Mill Trail
- 175 Tree Line
- 670 Midnight Pass
- 168 Meadow View
- 176 Meadow View
- 662 Midnight Pass
- 181 Tree Line
- 168 Tree Line
- 180 Meadow View
- 160 Tree Line
- 176 Tree Line
- 189 Tree Line
- 180 Tree Line
- 671 Midnight Pass
- 190 Meadow View
- 663 Midnight Pass
- 167 Meadow View
- 188 Tree Line
- 655 Midnight Pass
- 640 Midnight Pass
- 142 Tree Line