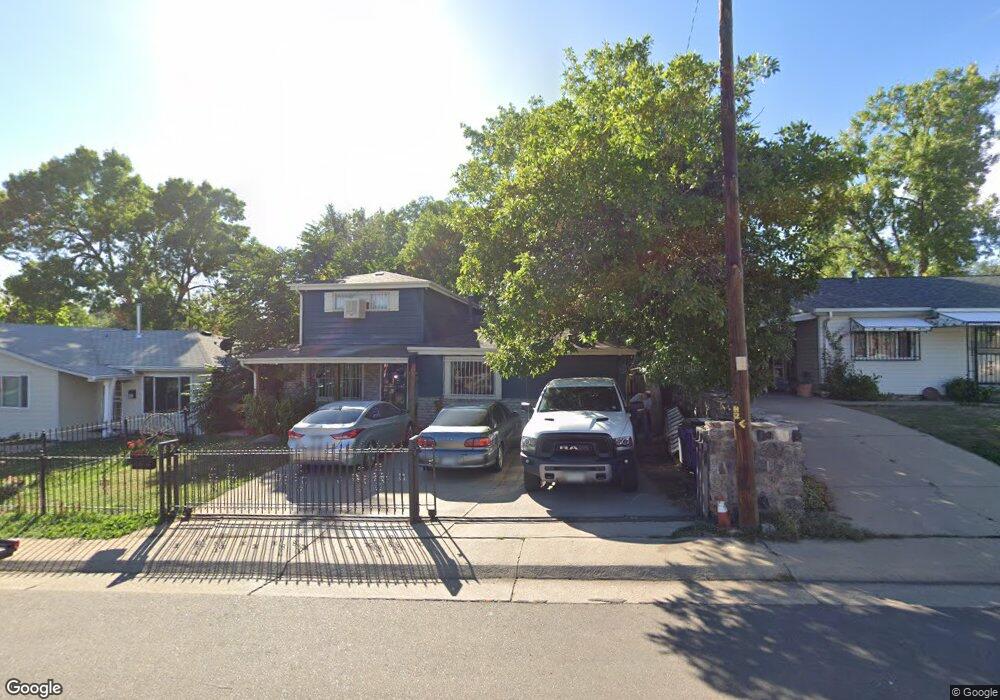
167 Vrain St Denver, CO 80219
Barnum NeighborhoodEstimated Value: $443,047 - $507,000
4
Beds
2
Baths
1,639
Sq Ft
$292/Sq Ft
Est. Value
About This Home
This home is located at 167 Vrain St, Denver, CO 80219 and is currently estimated at $478,262, approximately $291 per square foot. 167 Vrain St is a home located in Denver County with nearby schools including Newlon Elementary School, Kepner Beacon Middle School, and West High School.
Ownership History
Date
Name
Owned For
Owner Type
Purchase Details
Closed on
Dec 4, 2024
Sold by
Arredondo Jose A and Arredondo Peggy
Bought by
Arredondo Jose A and Arredondo Melissa
Current Estimated Value
Home Financials for this Owner
Home Financials are based on the most recent Mortgage that was taken out on this home.
Original Mortgage
$260,000
Interest Rate
6.72%
Mortgage Type
New Conventional
Purchase Details
Closed on
Oct 17, 1995
Sold by
Shultz Jack V and Shultz Betty J
Bought by
Arredondo Jose A and Arredondo Peggy
Home Financials for this Owner
Home Financials are based on the most recent Mortgage that was taken out on this home.
Original Mortgage
$87,577
Interest Rate
7.62%
Mortgage Type
FHA
Create a Home Valuation Report for This Property
The Home Valuation Report is an in-depth analysis detailing your home's value as well as a comparison with similar homes in the area
Home Values in the Area
Average Home Value in this Area
Purchase History
| Date | Buyer | Sale Price | Title Company |
|---|---|---|---|
| Arredondo Jose A | -- | Htc (Heritage Title) | |
| Arredondo Jose A | $87,950 | -- |
Source: Public Records
Mortgage History
| Date | Status | Borrower | Loan Amount |
|---|---|---|---|
| Previous Owner | Arredondo Jose A | $260,000 | |
| Previous Owner | Arredondo Jose A | $87,577 |
Source: Public Records
Tax History
| Year | Tax Paid | Tax Assessment Tax Assessment Total Assessment is a certain percentage of the fair market value that is determined by local assessors to be the total taxable value of land and additions on the property. | Land | Improvement |
|---|---|---|---|---|
| 2025 | $2,209 | $30,060 | $9,330 | $9,330 |
| 2024 | $2,209 | $27,890 | $5,180 | $22,710 |
| 2023 | $2,161 | $27,890 | $5,180 | $22,710 |
| 2022 | $1,866 | $23,470 | $7,350 | $16,120 |
| 2021 | $1,802 | $24,150 | $7,560 | $16,590 |
| 2020 | $1,471 | $19,820 | $7,090 | $12,730 |
| 2019 | $1,429 | $19,820 | $7,090 | $12,730 |
| 2018 | $1,225 | $15,830 | $7,140 | $8,690 |
| 2017 | $1,221 | $15,830 | $7,140 | $8,690 |
| 2016 | $957 | $11,730 | $4,736 | $6,994 |
| 2015 | $916 | $11,730 | $4,736 | $6,994 |
| 2014 | $690 | $8,310 | $3,160 | $5,150 |
Source: Public Records
Map
Nearby Homes