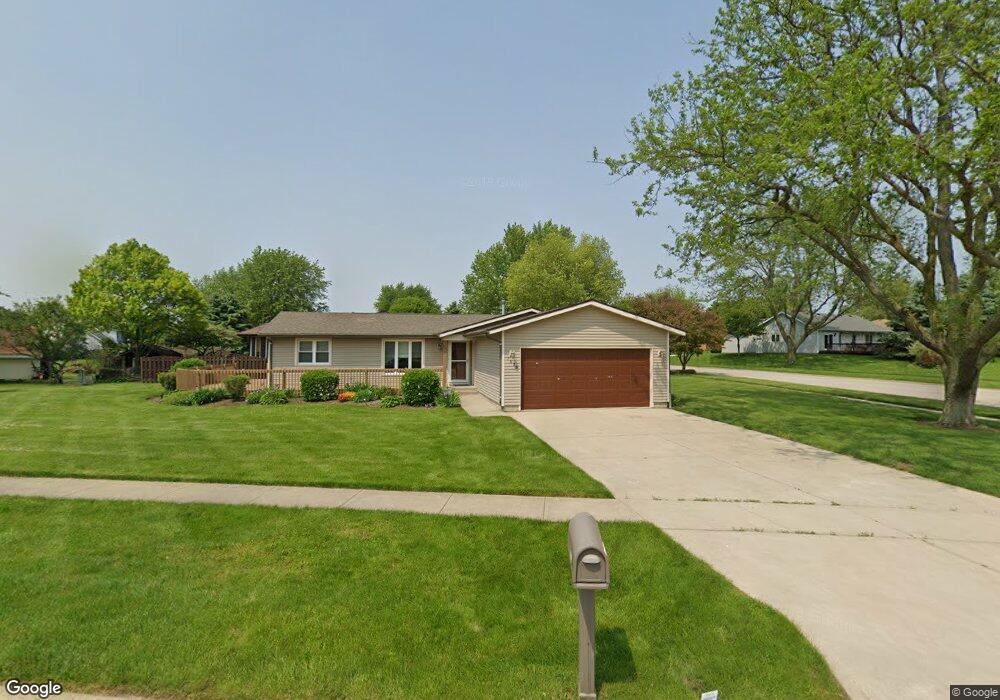
167 W Carol Ave Cortland, IL 60112
Estimated Value: $267,851 - $299,000
3
Beds
2
Baths
1,160
Sq Ft
$239/Sq Ft
Est. Value
About This Home
This home is located at 167 W Carol Ave, Cortland, IL 60112 and is currently estimated at $277,713, approximately $239 per square foot. 167 W Carol Ave is a home located in DeKalb County with nearby schools including Cortland Elementary School, Huntley Middle School, and De Kalb High School.
Ownership History
Date
Name
Owned For
Owner Type
Purchase Details
Closed on
Aug 31, 2010
Sold by
Kennett Brett L
Bought by
Anderson Theresa L
Current Estimated Value
Home Financials for this Owner
Home Financials are based on the most recent Mortgage that was taken out on this home.
Original Mortgage
$133,536
Outstanding Balance
$88,891
Interest Rate
4.6%
Mortgage Type
FHA
Estimated Equity
$188,822
Purchase Details
Closed on
May 7, 2010
Sold by
Federal Home Loan Mortgage Corporation
Bought by
Kennett Brett L and Kennett Diane L
Home Financials for this Owner
Home Financials are based on the most recent Mortgage that was taken out on this home.
Original Mortgage
$75,000
Interest Rate
18%
Mortgage Type
Commercial
Purchase Details
Closed on
Jan 15, 2010
Sold by
Dekalb County Sheriff
Bought by
Federal Home Loan Mortgage Corporation
Create a Home Valuation Report for This Property
The Home Valuation Report is an in-depth analysis detailing your home's value as well as a comparison with similar homes in the area
Home Values in the Area
Average Home Value in this Area
Purchase History
| Date | Buyer | Sale Price | Title Company |
|---|---|---|---|
| Anderson Theresa L | $135,000 | -- | |
| Kennett Brett L | $75,000 | -- | |
| Federal Home Loan Mortgage Corporation | -- | -- |
Source: Public Records
Mortgage History
| Date | Status | Borrower | Loan Amount |
|---|---|---|---|
| Open | Anderson Theresa L | $133,536 | |
| Previous Owner | Kennett Brett L | $75,000 |
Source: Public Records
Tax History Compared to Growth
Tax History
| Year | Tax Paid | Tax Assessment Tax Assessment Total Assessment is a certain percentage of the fair market value that is determined by local assessors to be the total taxable value of land and additions on the property. | Land | Improvement |
|---|---|---|---|---|
| 2024 | $5,217 | $68,055 | $13,401 | $54,654 |
| 2023 | $5,217 | $63,668 | $12,537 | $51,131 |
| 2022 | $4,927 | $57,446 | $11,965 | $45,481 |
| 2021 | $4,834 | $51,631 | $11,392 | $40,239 |
| 2020 | $4,824 | $50,021 | $11,037 | $38,984 |
| 2019 | $4,662 | $47,922 | $10,574 | $37,348 |
| 2018 | $5,246 | $51,830 | $13,110 | $38,720 |
| 2017 | $5,159 | $49,343 | $12,481 | $36,862 |
| 2016 | $4,916 | $46,375 | $11,730 | $34,645 |
| 2015 | -- | $45,838 | $11,015 | $34,823 |
| 2014 | -- | $35,782 | $10,602 | $25,180 |
| 2013 | -- | $37,080 | $10,987 | $26,093 |
Source: Public Records
Map
Nearby Homes
- 167 W Carol Ave
- Lot B6 W Paw Ave
- Lot B5 W Paw Ave
- 95 Lots Chestnut Grove
- 300 N Aspen Dr
- 241 N Somonauk Rd
- 329 N Aspen Dr
- 335 N Aspen Dr
- 341 N Aspen Dr
- 347 N Aspen Dr
- 353 N Aspen Dr
- 67 S Somonauk Rd
- 86 E Daisy Ave
- 437 N Charles St Unit 7
- Lot A16 Llanos St
- Lot B16 Llanos St
- 154 S Llanos St
- 152 S Llanos St
- 152 Llanos St
- 154 Llanos St
- 143 N Aspen Dr
- 174 W Carol Ave
- 149 W Carol Ave
- 179 W Carol Ave
- 99 N Aspen Dr
- 190 W Carol Ave
- 151 N Aspen Dr
- 150 N Hickory St
- 142 W Carol Ave
- 163 N Aspen Dr
- 148 W Susan Ave
- 160 N Hickory St
- 160 N Hickory St
- 126 N Hickory St
- 140 W Susan Ave
- 91 N Aspen Dr
- 167 N Aspen Dr
- 130 W Susan Ave
- 149 W Susan Ave
- 108 N Aspen Dr