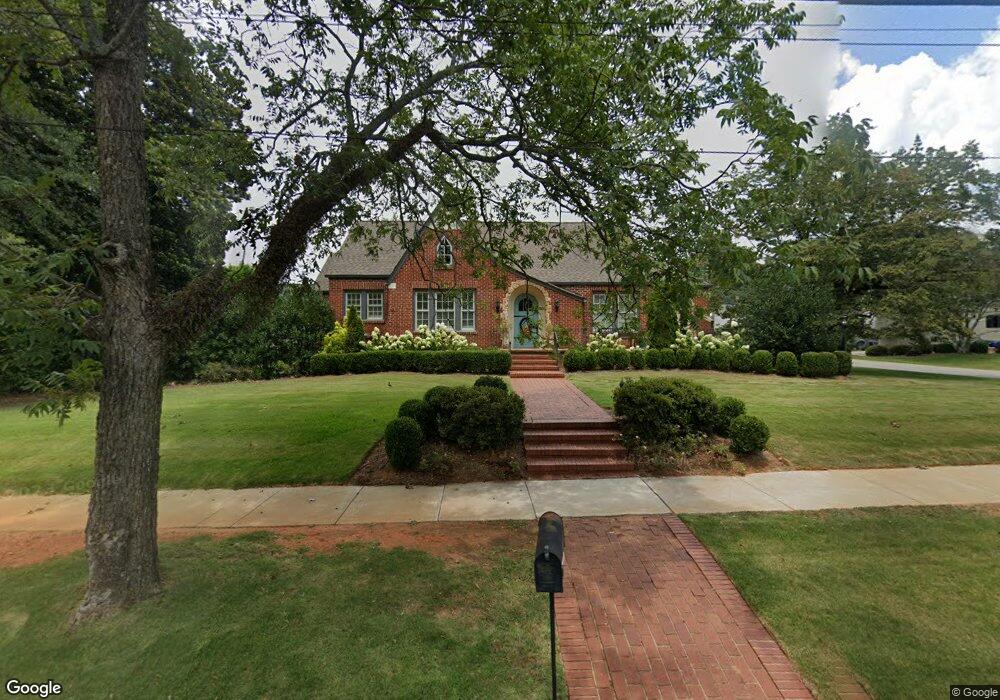
167 W Main St Forsyth, GA 31029
Estimated Value: $239,000 - $344,000
3
Beds
3
Baths
1,688
Sq Ft
$165/Sq Ft
Est. Value
About This Home
This home is located at 167 W Main St, Forsyth, GA 31029 and is currently estimated at $279,011, approximately $165 per square foot. 167 W Main St is a home located in Monroe County with nearby schools including Samuel E. Hubbard Elementary School, Mary Persons High School, and Lighthouse Academy.
Ownership History
Date
Name
Owned For
Owner Type
Purchase Details
Closed on
Feb 29, 2012
Sold by
Harkness Barbara S
Bought by
Tanner Isabelle S
Current Estimated Value
Home Financials for this Owner
Home Financials are based on the most recent Mortgage that was taken out on this home.
Original Mortgage
$101,700
Outstanding Balance
$69,961
Interest Rate
3.9%
Mortgage Type
New Conventional
Estimated Equity
$209,050
Purchase Details
Closed on
Apr 15, 2003
Sold by
Holleman Kristen W
Bought by
Harkness Charles W and Harkness Barbara S
Purchase Details
Closed on
Aug 30, 2002
Sold by
Ham Phillip Benson and Ham Dana
Bought by
Holleman Kristen W
Purchase Details
Closed on
Mar 8, 1999
Sold by
Wangerin Hollie N H and Wangerin Kevin A
Bought by
Ham Phillip Benson and Ham Dana
Purchase Details
Closed on
Jul 24, 1992
Sold by
Hunnicutt Wallace R and Baker Trellis H
Bought by
Wangerin Hollie N H and Wangerin Kevin A
Create a Home Valuation Report for This Property
The Home Valuation Report is an in-depth analysis detailing your home's value as well as a comparison with similar homes in the area
Home Values in the Area
Average Home Value in this Area
Purchase History
| Date | Buyer | Sale Price | Title Company |
|---|---|---|---|
| Tanner Isabelle S | $113,000 | -- | |
| Harkness Charles W | $105,500 | -- | |
| Holleman Kristen W | $100,000 | -- | |
| Ham Phillip Benson | $80,000 | -- | |
| Wangerin Hollie N H | $67,500 | -- |
Source: Public Records
Mortgage History
| Date | Status | Borrower | Loan Amount |
|---|---|---|---|
| Open | Tanner Isabelle S | $101,700 |
Source: Public Records
Tax History Compared to Growth
Tax History
| Year | Tax Paid | Tax Assessment Tax Assessment Total Assessment is a certain percentage of the fair market value that is determined by local assessors to be the total taxable value of land and additions on the property. | Land | Improvement |
|---|---|---|---|---|
| 2024 | $2,166 | $83,160 | $5,160 | $78,000 |
| 2023 | $2,085 | $71,760 | $5,160 | $66,600 |
| 2022 | $1,792 | $71,760 | $5,160 | $66,600 |
| 2021 | $1,849 | $71,760 | $5,160 | $66,600 |
| 2020 | $1,926 | $71,760 | $5,160 | $66,600 |
| 2019 | $1,940 | $71,760 | $5,160 | $66,600 |
| 2018 | $1,663 | $62,960 | $5,160 | $57,800 |
| 2017 | $2,019 | $62,960 | $5,160 | $57,800 |
| 2016 | $1,214 | $39,640 | $5,160 | $34,480 |
| 2015 | $1,157 | $39,640 | $5,160 | $34,480 |
| 2014 | $1,141 | $39,640 | $5,160 | $34,480 |
Source: Public Records
Map
Nearby Homes
- 333 W Main St
- 200 Indian Springs Dr
- 225 N Indian Springs Dr
- 263 Martin Luther King jr Dr
- S S Lee St
- 0 S Lee St Unit 10646818
- 101 E Chambers St
- 3487 Georgia 42
- 3271 Georgia 42
- 3471 Georgia 42
- 394 Brookwood Dr
- 507 W Main St
- 84 Hillsdale Rd
- 397 Ensign Rd
- 285 E Main St
- 299 Willis Wilder Dr
- 205 Solomon St
- 120 Willis Wilder Dr
- 60 Dew Place
- 0 Patrol Rd Unit 10473001
- 168 W Johnston St
- 180 W Johnston St
- 151 W Main St
- 150 W Johnston St
- 166 W Main St
- 191 W Main St
- 152 W Main St
- 190 W Johnston St
- 184 W Main St
- 141 W Main St
- 142 W Main St
- 148 W Johnston St
- 203 W Main St
- 200 W Johnston St
- 171 W Johnston St
- 161 W Johnston St
- 129 W Main St
- 147 W Johnston St
- 189 W Johnston St
- 126 W Johnston St