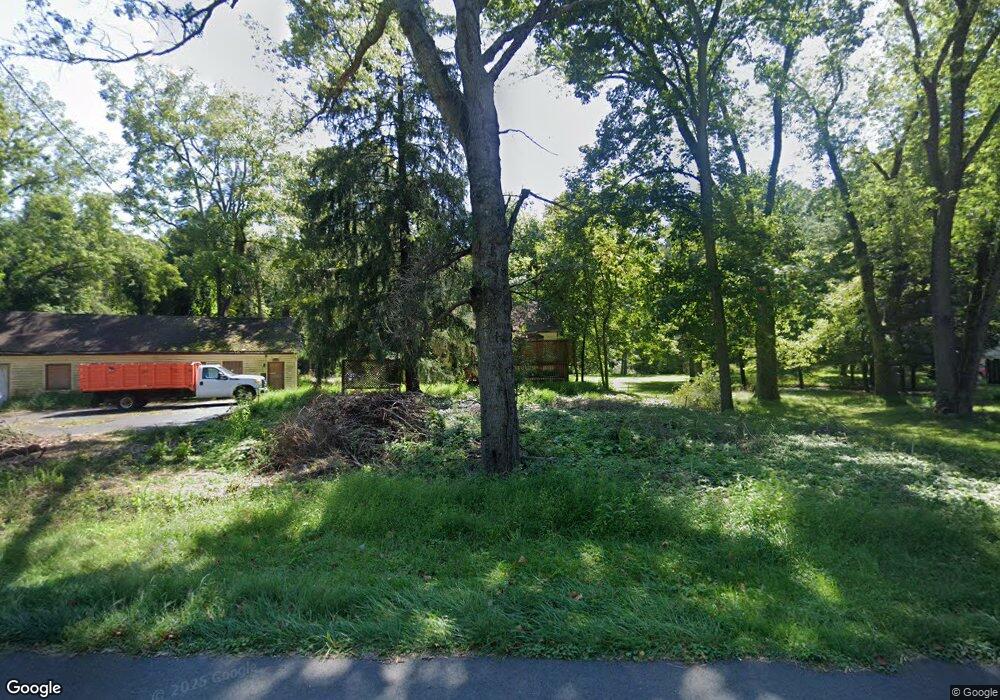
167 W Main St High Bridge, NJ 08829
Estimated Value: $172,000 - $417,000
--
Bed
--
Bath
1,145
Sq Ft
$250/Sq Ft
Est. Value
About This Home
This home is located at 167 W Main St, High Bridge, NJ 08829 and is currently estimated at $286,291, approximately $250 per square foot. 167 W Main St is a home located in Hunterdon County with nearby schools including Spruce Run School, Patrick McGaheran School, and Round Valley School.
Ownership History
Date
Name
Owned For
Owner Type
Purchase Details
Closed on
Nov 2, 2023
Sold by
Hunterdon County Sheriffs
Bought by
Long Beach Mortgage Loan Trust and Boak Robert
Current Estimated Value
Purchase Details
Closed on
May 7, 1998
Sold by
Fox James W
Bought by
Bisher Russell Lee and Cummings Candace C
Home Financials for this Owner
Home Financials are based on the most recent Mortgage that was taken out on this home.
Original Mortgage
$130,000
Interest Rate
7.05%
Create a Home Valuation Report for This Property
The Home Valuation Report is an in-depth analysis detailing your home's value as well as a comparison with similar homes in the area
Home Values in the Area
Average Home Value in this Area
Purchase History
| Date | Buyer | Sale Price | Title Company |
|---|---|---|---|
| Long Beach Mortgage Loan Trust | $235,192 | None Listed On Document | |
| Bisher Russell Lee | $162,550 | -- |
Source: Public Records
Mortgage History
| Date | Status | Borrower | Loan Amount |
|---|---|---|---|
| Previous Owner | Bisher Russell Lee | $130,000 |
Source: Public Records
Tax History Compared to Growth
Tax History
| Year | Tax Paid | Tax Assessment Tax Assessment Total Assessment is a certain percentage of the fair market value that is determined by local assessors to be the total taxable value of land and additions on the property. | Land | Improvement |
|---|---|---|---|---|
| 2025 | $4,379 | $146,900 | $101,000 | $45,900 |
| 2024 | $4,244 | $146,900 | $101,000 | $45,900 |
| 2023 | $4,244 | $146,900 | $101,000 | $45,900 |
| 2022 | $4,125 | $146,900 | $101,000 | $45,900 |
| 2021 | $3,894 | $146,900 | $101,000 | $45,900 |
| 2020 | $3,959 | $146,900 | $101,000 | $45,900 |
| 2019 | $3,894 | $146,900 | $101,000 | $45,900 |
| 2018 | $4,621 | $176,300 | $101,000 | $75,300 |
| 2017 | $4,473 | $176,300 | $101,000 | $75,300 |
| 2016 | $4,467 | $176,300 | $101,000 | $75,300 |
| 2015 | $4,496 | $176,300 | $101,000 | $75,300 |
| 2014 | $4,393 | $176,300 | $101,000 | $75,300 |
Source: Public Records
Map
Nearby Homes