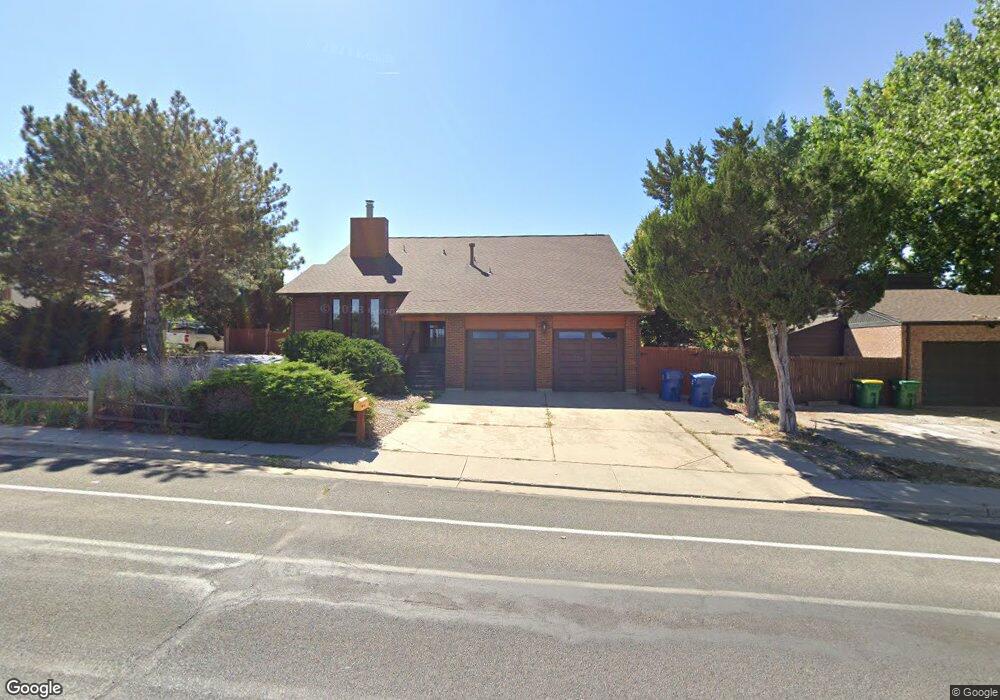
1670 E Southern St Brighton, CO 80601
Estimated Value: $502,000 - $538,000
3
Beds
3
Baths
2,222
Sq Ft
$236/Sq Ft
Est. Value
About This Home
This home is located at 1670 E Southern St, Brighton, CO 80601 and is currently estimated at $523,318, approximately $235 per square foot. 1670 E Southern St is a home located in Adams County with nearby schools including Southeast Elementary School, Vikan Middle School, and Brighton High School.
Ownership History
Date
Name
Owned For
Owner Type
Purchase Details
Closed on
Jun 1, 2020
Sold by
Cavanaugh Michael and Cavanaugh Manuela L
Bought by
Murray Marisol and Murray Donald
Current Estimated Value
Home Financials for this Owner
Home Financials are based on the most recent Mortgage that was taken out on this home.
Original Mortgage
$392,850
Outstanding Balance
$348,881
Interest Rate
3.3%
Mortgage Type
New Conventional
Estimated Equity
$174,437
Purchase Details
Closed on
May 30, 1997
Sold by
Curtis George L
Bought by
Cavanaugh Michael and Cavanaugh Manuela L
Home Financials for this Owner
Home Financials are based on the most recent Mortgage that was taken out on this home.
Original Mortgage
$118,400
Interest Rate
8.1%
Purchase Details
Closed on
Jan 10, 1996
Sold by
Jones Stephen C and Jones Valerie Ann
Bought by
Curtis George L
Home Financials for this Owner
Home Financials are based on the most recent Mortgage that was taken out on this home.
Original Mortgage
$126,900
Interest Rate
7.14%
Mortgage Type
Balloon
Create a Home Valuation Report for This Property
The Home Valuation Report is an in-depth analysis detailing your home's value as well as a comparison with similar homes in the area
Home Values in the Area
Average Home Value in this Area
Purchase History
| Date | Buyer | Sale Price | Title Company |
|---|---|---|---|
| Murray Marisol | $405,000 | Land Title Guarantee Co | |
| Cavanaugh Michael | $148,000 | Land Title | |
| Curtis George L | $141,000 | -- |
Source: Public Records
Mortgage History
| Date | Status | Borrower | Loan Amount |
|---|---|---|---|
| Open | Murray Marisol | $392,850 | |
| Previous Owner | Cavanaugh Michael | $118,400 | |
| Previous Owner | Curtis George L | $126,900 |
Source: Public Records
Tax History Compared to Growth
Tax History
| Year | Tax Paid | Tax Assessment Tax Assessment Total Assessment is a certain percentage of the fair market value that is determined by local assessors to be the total taxable value of land and additions on the property. | Land | Improvement |
|---|---|---|---|---|
| 2024 | $3,874 | $33,120 | $6,560 | $26,560 |
| 2023 | $3,852 | $38,420 | $7,100 | $31,320 |
| 2022 | $2,986 | $26,920 | $6,670 | $20,250 |
| 2021 | $2,811 | $26,920 | $6,670 | $20,250 |
| 2020 | $1,857 | $25,740 | $6,860 | $18,880 |
| 2019 | $1,861 | $25,740 | $6,860 | $18,880 |
| 2018 | $1,506 | $22,200 | $6,480 | $15,720 |
| 2017 | $2,233 | $22,200 | $6,480 | $15,720 |
| 2016 | $1,654 | $16,360 | $3,900 | $12,460 |
| 2015 | $1,643 | $16,360 | $3,900 | $12,460 |
| 2014 | $1,329 | $13,400 | $2,950 | $10,450 |
Source: Public Records
Map
Nearby Homes
- 406 S 16th Ave
- 434 Voiles Dr
- 2084 Donna Ct
- 628 S 16th Ave
- 316 S 22nd Ave
- 290 S 22nd Ave
- 595 Badger Creek Dr
- 551 Longhurst Place
- 465 S 24th Ave
- 319 S 25th Ave
- 791 S 21st Ct
- 253 S 25th Ave
- 2277 Wingler Place
- 321 S 26th Ave
- 792 S 12th Ave
- 63 S 22nd Ave Unit A1-B8
- 2364 Cherry St
- 933 Skeel St
- 2618 E Egbert St
- 2587 E Egbert St
- 457 S 17th Ave
- 436 S 16th Ave
- 408 S 17th Ave
- 497 S 17th Ave
- 488 S 17th Ave
- 466 S 16th Ave
- 1780 E Southern St
- 405 S 16th Ave
- 496 S 16th Ave
- 435 S 16th Ave
- 1810 E Southern St
- 465 S 16th Ave
- 495 S 16th Ave
- 404 Voiles Dr
- 414 Voiles Dr
- 419 Poppy Dr
- 427 Poppy Dr
- 417 Poppy Dr
- 1850 E Southern St
- 437 Poppy Dr