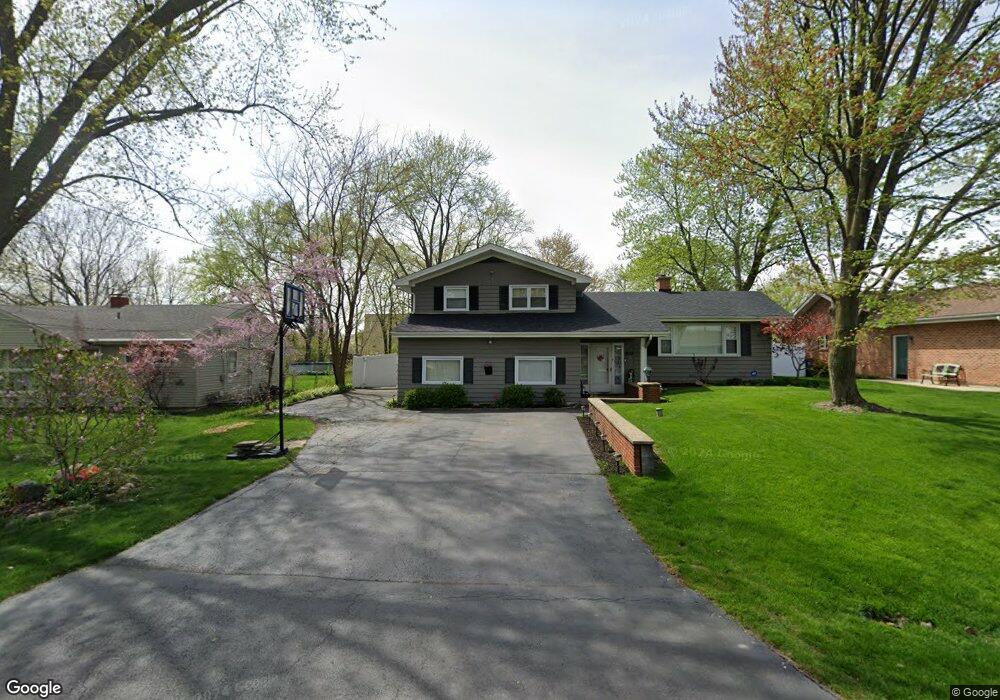
1670 Gary Ave Aurora, IL 60505
Indian Creek NeighborhoodEstimated Value: $336,000 - $409,000
4
Beds
2
Baths
2,068
Sq Ft
$176/Sq Ft
Est. Value
About This Home
This home is located at 1670 Gary Ave, Aurora, IL 60505 and is currently estimated at $363,887, approximately $175 per square foot. 1670 Gary Ave is a home located in Kane County with nearby schools including Mabel O Donnell Elementary School, Simmons Middle School, and East Aurora High School.
Ownership History
Date
Name
Owned For
Owner Type
Purchase Details
Closed on
Jul 3, 2008
Sold by
Hernandez Carina and Contreras Guadalupe Sanchez
Bought by
Hernandez Carina and Sanchez Jorge
Current Estimated Value
Home Financials for this Owner
Home Financials are based on the most recent Mortgage that was taken out on this home.
Original Mortgage
$217,757
Interest Rate
6.5%
Mortgage Type
New Conventional
Purchase Details
Closed on
May 11, 2007
Sold by
Suddreth Cynthia L
Bought by
Hernandez Carina and Contreras Guadalupe Sanchez
Home Financials for this Owner
Home Financials are based on the most recent Mortgage that was taken out on this home.
Original Mortgage
$209,709
Interest Rate
6.22%
Mortgage Type
FHA
Purchase Details
Closed on
May 28, 1999
Sold by
Gardner Ramon W and Gardner Cheryl A
Bought by
Suddreth James V and Suddreth Cynthia L
Home Financials for this Owner
Home Financials are based on the most recent Mortgage that was taken out on this home.
Original Mortgage
$129,985
Interest Rate
6.99%
Mortgage Type
FHA
Create a Home Valuation Report for This Property
The Home Valuation Report is an in-depth analysis detailing your home's value as well as a comparison with similar homes in the area
Home Values in the Area
Average Home Value in this Area
Purchase History
| Date | Buyer | Sale Price | Title Company |
|---|---|---|---|
| Hernandez Carina | -- | Law Title Insurance | |
| Hernandez Carina | $213,000 | Multiple | |
| Suddreth James V | $131,500 | First American Title Ins Co |
Source: Public Records
Mortgage History
| Date | Status | Borrower | Loan Amount |
|---|---|---|---|
| Previous Owner | Hernandez Carina | $217,757 | |
| Previous Owner | Hernandez Carina | $209,709 | |
| Previous Owner | Suddreth James V | $129,985 |
Source: Public Records
Tax History
| Year | Tax Paid | Tax Assessment Tax Assessment Total Assessment is a certain percentage of the fair market value that is determined by local assessors to be the total taxable value of land and additions on the property. | Land | Improvement |
|---|---|---|---|---|
| 2024 | $5,005 | $107,049 | $11,935 | $95,114 |
| 2023 | $4,849 | $95,648 | $10,664 | $84,984 |
| 2022 | $4,542 | $87,270 | $9,730 | $77,540 |
| 2021 | $4,509 | $81,250 | $9,059 | $72,191 |
| 2020 | $4,292 | $75,469 | $8,414 | $67,055 |
| 2019 | $4,238 | $69,924 | $7,796 | $62,128 |
| 2018 | $4,390 | $69,074 | $7,211 | $61,863 |
| 2017 | $4,237 | $61,823 | $6,644 | $55,179 |
| 2016 | $4,453 | $59,776 | $7,593 | $52,183 |
| 2015 | -- | $52,716 | $6,529 | $46,187 |
| 2014 | -- | $49,431 | $6,279 | $43,152 |
| 2013 | -- | $51,230 | $6,190 | $45,040 |
Source: Public Records
Map
Nearby Homes
- 1050 N Farnsworth Ave Unit 111
- 1826 N Farnsworth Ave
- 1750 N Marywood Ave Unit 305
- 1750 N Marywood Ave Unit 315
- 1870 Tall Oaks Dr Unit 2104
- Lot 1 Reckinger Rd
- 1578 Colleen Ln
- 1110 N Farnsworth Ave Unit 213
- 1110 N Farnsworth Ave Unit 211
- 0000 N Farnsworth Ave
- 1060 N Farnsworth Ave Unit 1105
- 1923 Schomer Ct
- 2315 Nan St
- 1771 Briarheath Dr
- 1160 N Ohio St Unit 62
- 2752 Preserve Cir Unit 13006
- 2748 Preserve Cir Unit 13005
- 2732 Preserve Cir Unit 13001
- 2892 Preserve Cir Unit 5003
- 2888 Preserve Cir Unit 5002
- 1660 Gary Ave
- 1680 Gary Ave
- 1650 Gary Ave Unit 2
- 1686 Gary Ave
- 1681 Gary Ave
- 1651 Gary Ave
- 1690 Gary Ave
- 1671 Gary Ave
- 1661 Gary Ave Unit 2
- 1691 Gary Ave
- 1710 Gary Ave
- 1711 Gary Ave
- 1725 N Farnsworth Ave Unit 3
- 1725 N Farnsworth Ave Unit 4
- 1725 N Farnsworth Ave Unit 2
- 1725 N Farnsworth Ave
- 1721 Gary Ave
- 1720 Gary Ave
- 1731 Gary Ave
- 1740 Gary Ave
Your Personal Tour Guide
Ask me questions while you tour the home.