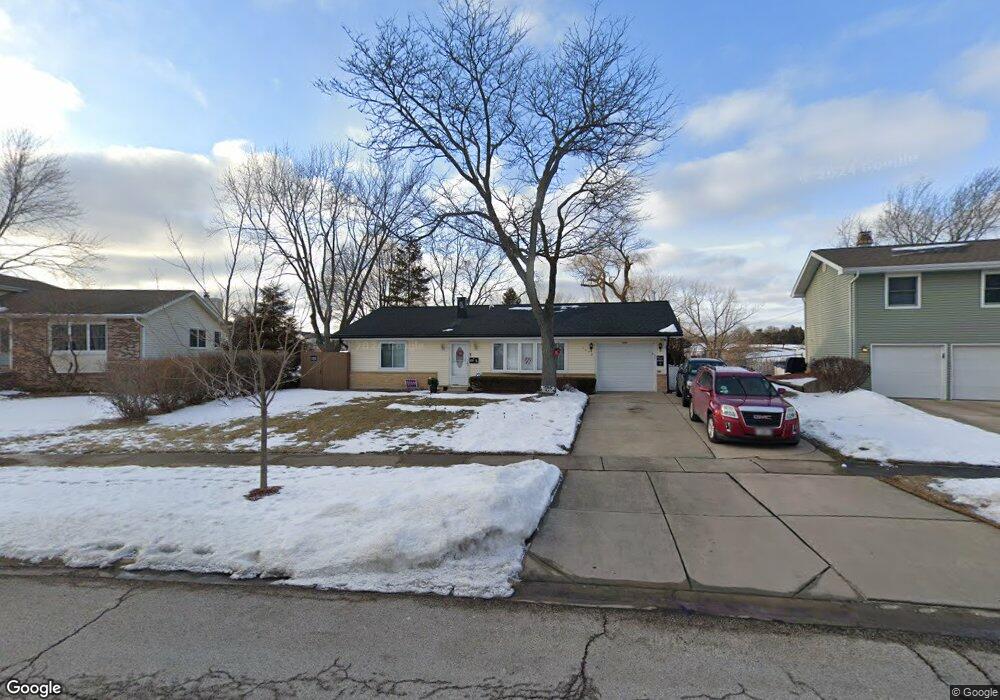
1670 Kingsdale Rd Hoffman Estates, IL 60169
High Point Park NeighborhoodEstimated Value: $397,000 - $504,000
3
Beds
2
Baths
1,356
Sq Ft
$320/Sq Ft
Est. Value
About This Home
This home is located at 1670 Kingsdale Rd, Hoffman Estates, IL 60169 and is currently estimated at $434,067, approximately $320 per square foot. 1670 Kingsdale Rd is a home located in Cook County with nearby schools including MacArthur International Spanish Academy, Dwight D Eisenhower Junior High School, and Hoffman Estates High School.
Ownership History
Date
Name
Owned For
Owner Type
Purchase Details
Closed on
Jan 20, 2016
Sold by
Niklinski Ted M and Delacruz Niklinski Shirley
Bought by
The Ted Niklinski & Shirley Delacruz Nik
Current Estimated Value
Purchase Details
Closed on
Oct 20, 2004
Sold by
Delacruz Niklinski Ted M and Delacruz Niklinski Shirley
Bought by
Mitchell Karen A
Purchase Details
Closed on
Aug 23, 2002
Sold by
Holub Barbara J and Holub Peggy A
Bought by
Delacruz Niklinski Ted M and Delacruz Niklinski Shirley
Home Financials for this Owner
Home Financials are based on the most recent Mortgage that was taken out on this home.
Original Mortgage
$205,770
Interest Rate
6.13%
Mortgage Type
FHA
Purchase Details
Closed on
May 24, 2000
Sold by
Holub Barbara J and Holub Peggy A
Bought by
Holub Barbara J and Holub Peggy A
Home Financials for this Owner
Home Financials are based on the most recent Mortgage that was taken out on this home.
Original Mortgage
$75,000
Interest Rate
9.65%
Create a Home Valuation Report for This Property
The Home Valuation Report is an in-depth analysis detailing your home's value as well as a comparison with similar homes in the area
Home Values in the Area
Average Home Value in this Area
Purchase History
| Date | Buyer | Sale Price | Title Company |
|---|---|---|---|
| The Ted Niklinski & Shirley Delacruz Nik | -- | Attorney | |
| Mitchell Karen A | $5,000 | Cti | |
| Delacruz Niklinski Ted M | $209,000 | Agtf Inc | |
| Holub Barbara J | -- | -- |
Source: Public Records
Mortgage History
| Date | Status | Borrower | Loan Amount |
|---|---|---|---|
| Previous Owner | Delacruz Niklinski Ted M | $205,770 | |
| Previous Owner | Holub Barbara J | $75,000 |
Source: Public Records
Tax History Compared to Growth
Tax History
| Year | Tax Paid | Tax Assessment Tax Assessment Total Assessment is a certain percentage of the fair market value that is determined by local assessors to be the total taxable value of land and additions on the property. | Land | Improvement |
|---|---|---|---|---|
| 2024 | $7,682 | $31,000 | $15,361 | $15,639 |
| 2023 | $8,191 | $31,000 | $15,361 | $15,639 |
| 2022 | $8,191 | $31,000 | $15,361 | $15,639 |
| 2021 | $6,796 | $23,615 | $10,240 | $13,375 |
| 2020 | $6,712 | $23,615 | $10,240 | $13,375 |
| 2019 | $6,678 | $26,239 | $10,240 | $15,999 |
| 2018 | $6,058 | $22,014 | $8,704 | $13,310 |
| 2017 | $5,969 | $22,014 | $8,704 | $13,310 |
| 2016 | $5,815 | $22,014 | $8,704 | $13,310 |
| 2015 | $5,435 | $19,545 | $7,680 | $11,865 |
| 2014 | $5,356 | $19,545 | $7,680 | $11,865 |
| 2013 | $5,201 | $19,545 | $7,680 | $11,865 |
Source: Public Records
Map
Nearby Homes
- 1456 Della Dr
- 1360 Devonshire Ln
- 1420 Hassell Rd
- 1704 Fayette Walk Unit B
- 1415 N Oakmont Rd
- 1365 Blair Ln
- 1360 Mayfield Ln
- 1800 Huntington Blvd Unit AE615
- 1940 Kenilworth Cir Unit D
- 1763 Bristol Walk Unit 1763
- 1445 Nottingham Ln
- 1738 Ardwick Dr
- 1854 Huntington Blvd Unit C
- 1808 Fayette Walk Unit H
- 1977 Kenilworth Cir Unit D
- 1352 W Oakmont Rd
- 1840 Huntington Blvd Unit 415
- 1840 Huntington Blvd Unit 412
- 2004 E Parkview Cir
- 1641 Churchill Rd
- 1680 Kingsdale Rd
- 1660 Kingsdale Rd
- 1682 Kingsdale Rd
- 1650 Kingsdale Rd
- 1675 Kingsdale Rd
- 1665 Kingsdale Rd
- 1685 Kingsdale Rd
- 1684 Kingsdale Rd
- 1640 Kingsdale Rd
- 1645 Kingsdale Rd
- 1687 Kingsdale Rd
- 1686 Kingsdale Rd
- 1630 Kingsdale Rd
- 1635 Kingsdale Rd
- 1650 Glen Lake Rd
- 1688 Kingsdale Rd
- 1689 Kingsdale Rd
- 1640 Glen Lake Rd
- 1620 Kingsdale Rd
- 1625 Kingsdale Rd