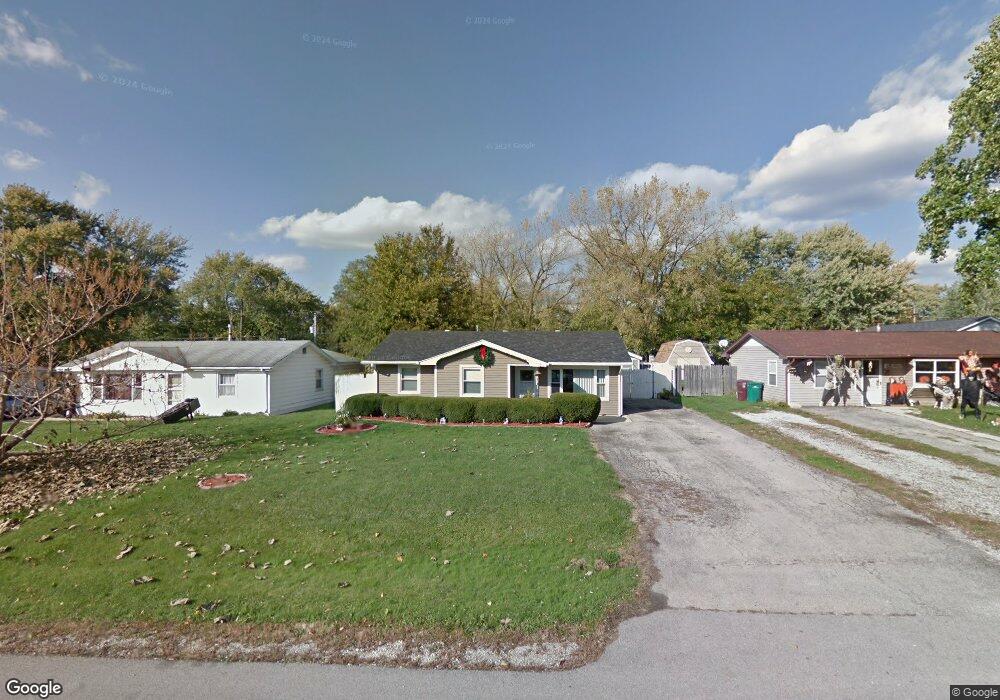
16702 W 147th Place Lockport, IL 60441
Big Run NeighborhoodEstimated Value: $210,064 - $277,000
Studio
--
Bath
1,049
Sq Ft
$221/Sq Ft
Est. Value
About This Home
This home is located at 16702 W 147th Place, Lockport, IL 60441 and is currently estimated at $231,516, approximately $220 per square foot. 16702 W 147th Place is a home with nearby schools including Ludwig Elementary School, Walsh Elementary School, and Reed Elementary School.
Ownership History
Date
Name
Owned For
Owner Type
Purchase Details
Closed on
Feb 14, 2022
Sold by
Tuskey Richard S
Bought by
Tuskey Cathy R and Tuskey Richard S
Current Estimated Value
Purchase Details
Closed on
Apr 22, 2010
Sold by
Tuskey Cathy R
Bought by
Tuskey Richard S
Purchase Details
Closed on
Jun 25, 1997
Sold by
Miranda Christine and Koscik Christine
Bought by
Tuskey Richard Scott and Tuskey Cathy R
Home Financials for this Owner
Home Financials are based on the most recent Mortgage that was taken out on this home.
Original Mortgage
$112,700
Interest Rate
8.01%
Mortgage Type
VA
Create a Home Valuation Report for This Property
The Home Valuation Report is an in-depth analysis detailing your home's value as well as a comparison with similar homes in the area
Home Values in the Area
Average Home Value in this Area
Purchase History
| Date | Buyer | Sale Price | Title Company |
|---|---|---|---|
| Tuskey Cathy R | -- | None Listed On Document | |
| Tuskey Richard S | -- | None Available | |
| Tuskey Richard Scott | $110,500 | -- |
Source: Public Records
Mortgage History
| Date | Status | Borrower | Loan Amount |
|---|---|---|---|
| Previous Owner | Tuskey Richard Scott | $112,700 |
Source: Public Records
Tax History
| Year | Tax Paid | Tax Assessment Tax Assessment Total Assessment is a certain percentage of the fair market value that is determined by local assessors to be the total taxable value of land and additions on the property. | Land | Improvement |
|---|---|---|---|---|
| 2024 | $4,241 | $72,410 | $18,904 | $53,506 |
| 2023 | $4,241 | $65,637 | $17,136 | $48,501 |
| 2022 | $3,462 | $55,980 | $13,584 | $42,396 |
| 2021 | $3,270 | $53,037 | $12,870 | $40,167 |
| 2020 | $3,267 | $51,085 | $12,396 | $38,689 |
| 2019 | $3,150 | $49,144 | $11,925 | $37,219 |
| 2018 | $3,083 | $47,508 | $11,788 | $35,720 |
| 2017 | $3,015 | $46,178 | $11,458 | $34,720 |
| 2016 | $2,935 | $44,638 | $11,076 | $33,562 |
| 2015 | $2,816 | $42,962 | $10,660 | $32,302 |
| 2014 | $2,816 | $42,075 | $10,440 | $31,635 |
| 2013 | $2,816 | $42,075 | $10,440 | $31,635 |
Source: Public Records
Map
Nearby Homes
- 1400 Smith Rd
- 14934 S Hillside Dr
- 16542 Golden Valley Ln
- 16535 Golden Valley Ln
- 14838 S Hillside Dr
- 16656 W Huntington Dr
- 1336 Tralee Ln
- 0 151st & MacGregor St Unit MRD11873272
- 0 Smith Rd South of 135th St Unit MRD12274096
- 0 N State St Unit 10995892
- 15303 S Oak Run Ct
- 904 Cove Ave
- 17528 Woodbrook Ln
- 16740 W Saddlewood Dr
- 14319 High Rd
- 514 N Lockwood Dr
- 14029 Cokes Rd
- 805 Maryknoll Dr
- 0000 Beth Dr
- 16701 135th St
- 16708 W 147th Place
- 16662 W 147th Place
- 16654 W 147th Place
- 16720 W 147th Place
- 16648 W 147th Place Unit 2
- 16703 W 147th Place
- 16709 W 147th Place Unit 1
- 16663 W 147th Place Unit 2
- 16661 W 146th Place
- 16707 W 146th Place
- 16713 W 147th Place
- 16657 W 147th Place
- 16715 W 146th Place Unit 1
- 16726 W 147th Place
- 16642 W 147th Place
- 16719 W 147th Place
- 16655 W 146th Place
- 16721 W 146th Place
- 16732 W 147th Place
- 16636 W 147th Place
Your Personal Tour Guide
Ask me questions while you tour the home.