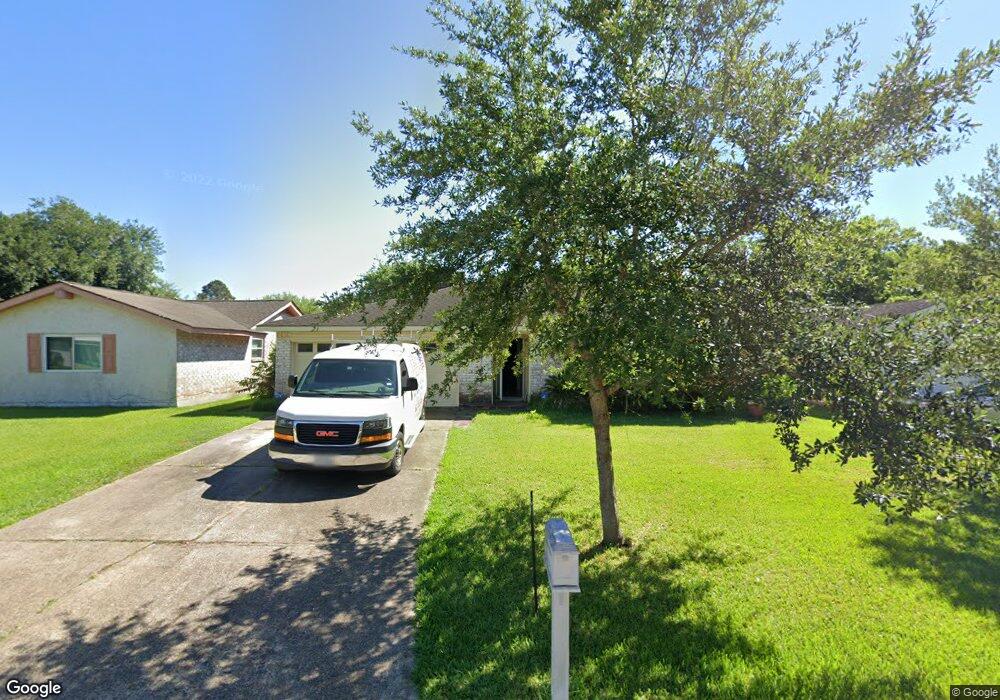
16703 Tibet Rd Friendswood, TX 77546
Estimated Value: $230,817 - $264,000
4
Beds
2
Baths
1,482
Sq Ft
$169/Sq Ft
Est. Value
About This Home
This home is located at 16703 Tibet Rd, Friendswood, TX 77546 and is currently estimated at $250,454, approximately $168 per square foot. 16703 Tibet Rd is a home located in Harris County with nearby schools including Wedgewood Elementary School, Brookside Intermediate School, and Clear Brook High School.
Ownership History
Date
Name
Owned For
Owner Type
Purchase Details
Closed on
May 18, 2022
Sold by
Ray Poore Jr James and Ray Deeann Nelda
Bought by
Keane Carolyn Inez
Current Estimated Value
Home Financials for this Owner
Home Financials are based on the most recent Mortgage that was taken out on this home.
Original Mortgage
$150,000
Outstanding Balance
$142,560
Interest Rate
5.3%
Mortgage Type
New Conventional
Estimated Equity
$107,894
Purchase Details
Closed on
Apr 12, 2012
Sold by
Leitner Virginia
Bought by
Poore James Ray
Home Financials for this Owner
Home Financials are based on the most recent Mortgage that was taken out on this home.
Original Mortgage
$107,211
Interest Rate
3.87%
Mortgage Type
FHA
Purchase Details
Closed on
Mar 31, 2010
Sold by
Maniha David
Bought by
Leitner Virginia
Create a Home Valuation Report for This Property
The Home Valuation Report is an in-depth analysis detailing your home's value as well as a comparison with similar homes in the area
Home Values in the Area
Average Home Value in this Area
Purchase History
| Date | Buyer | Sale Price | Title Company |
|---|---|---|---|
| Keane Carolyn Inez | -- | Fidelity National Title | |
| Poore James Ray | -- | None Available | |
| Leitner Virginia | -- | None Available |
Source: Public Records
Mortgage History
| Date | Status | Borrower | Loan Amount |
|---|---|---|---|
| Open | Keane Carolyn Inez | $150,000 | |
| Previous Owner | Poore James Ray | $107,211 |
Source: Public Records
Tax History Compared to Growth
Tax History
| Year | Tax Paid | Tax Assessment Tax Assessment Total Assessment is a certain percentage of the fair market value that is determined by local assessors to be the total taxable value of land and additions on the property. | Land | Improvement |
|---|---|---|---|---|
| 2025 | $3,223 | $252,130 | $57,998 | $194,132 |
| 2024 | $3,223 | $230,482 | $57,998 | $172,484 |
| 2023 | $3,223 | $235,641 | $57,998 | $177,643 |
| 2022 | $4,350 | $215,133 | $57,998 | $157,135 |
| 2021 | $4,349 | $202,028 | $48,840 | $153,188 |
| 2020 | $4,295 | $184,132 | $35,104 | $149,028 |
| 2019 | $4,095 | $169,207 | $27,473 | $141,734 |
| 2018 | $0 | $156,734 | $27,473 | $129,261 |
| 2017 | $4,017 | $156,734 | $27,473 | $129,261 |
| 2016 | $3,652 | $152,007 | $27,473 | $124,534 |
| 2015 | $339 | $138,741 | $27,473 | $111,268 |
| 2014 | $339 | $119,516 | $22,894 | $96,622 |
Source: Public Records
Map
Nearby Homes
- 16607 David Glen Dr
- 16907 Tibet Rd
- 16703 Hibiscus Ln
- 16811 Bougainvilla Ln
- 16823 Bougainvilla Ln
- 16510 Blackhawk Blvd
- 16926 Blackhawk Blvd
- 17003 Tibet Rd
- 16903 Paint Rock Rd
- 16922 Echo Harbor
- 4015 Ravine Dr
- 16406 Blackhawk Blvd
- 4311 Townes Forest Rd
- 16327 Blackhawk Blvd
- 3836 Laura Leigh Dr
- 4315 Ravine Dr
- 3878 Laura Leigh Dr
- 16303 Townes Rd
- 5323 Abercreek Ave
- 16915 Lighthouse View Dr
- 16707 Tibet Rd
- 16639 Tibet Rd
- 16702 Barcelona Dr
- 16711 Tibet Rd
- 16706 Barcelona Dr
- 16635 Tibet Rd
- 16638 Barcelona Dr
- 16710 Barcelona Dr
- 16634 Barcelona Dr
- 16702 Tibet Rd
- 16715 Tibet Rd
- 16706 Tibet Rd
- 16631 Tibet Rd
- 16638 Tibet Rd
- 16714 Barcelona Dr
- 16634 Tibet Rd
- 16630 Barcelona Dr
- 16719 Tibet Rd
- 16627 Tibet Rd
- 16714 Tibet Rd